
One data loop. From an ERP file to a board decision — and back to the sales rep.
This is what a week with SoldCalc looks like: who does what, what happens automatically and where the value is created along the way. No magic — step by step.
Data enters the system
Getting started requires no integration and no IT project. The administrator loads data from an Excel file exported from the sales system — SoldCalc recognises the columns itself (customers, products, sales, price lists) and cleans up date or name formats. On a full licence you can connect the database directly instead of files.
- Excel import with automatic column mapping — no data retyping
- On a full licence: connection to PostgreSQL / Microsoft Dataverse / SAP — strictly read-only
- Automatic sync schedule: the data refreshes itself
Sales and margin analysis computes itself
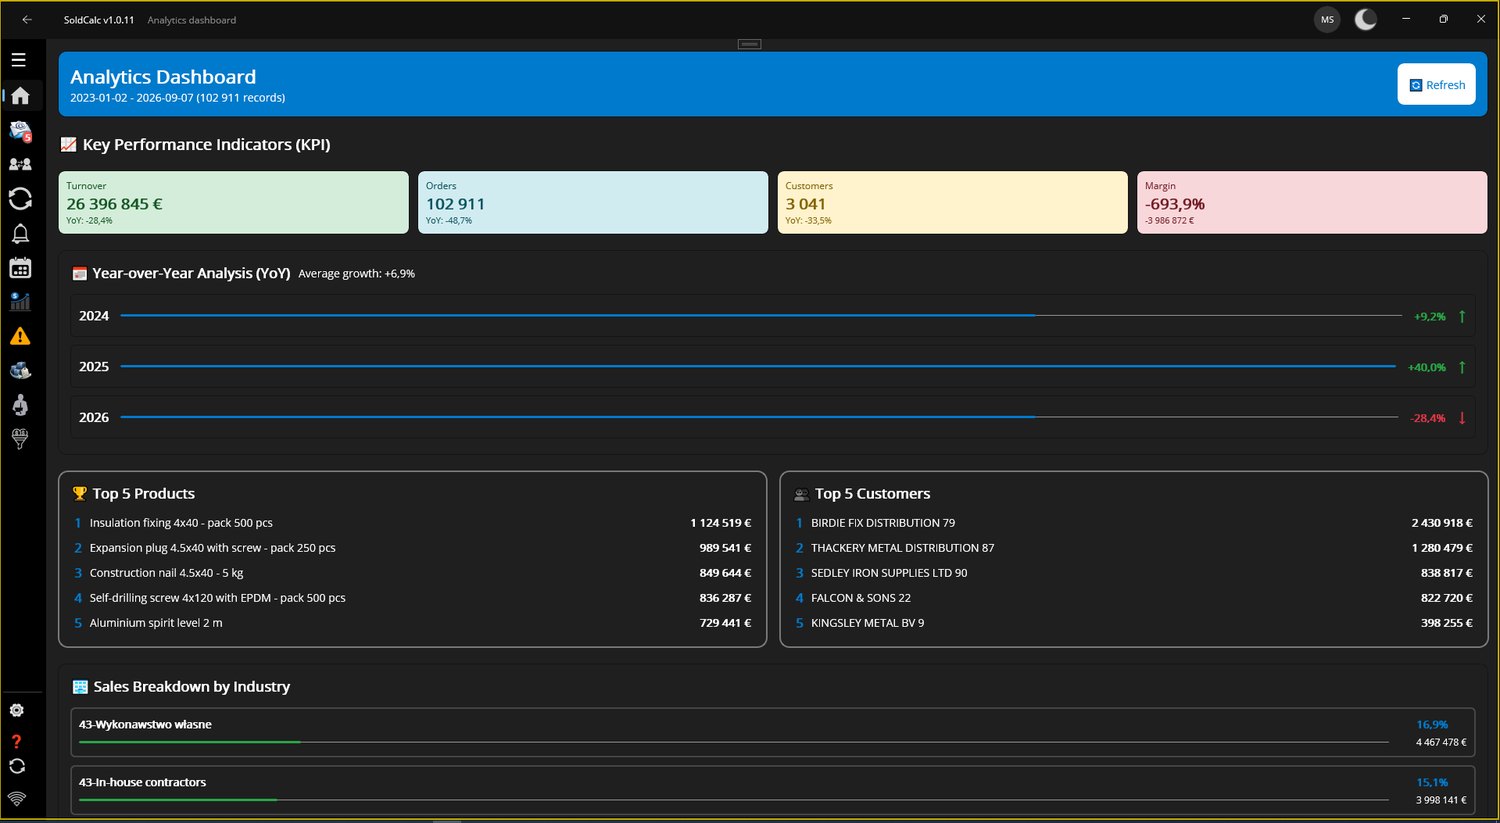
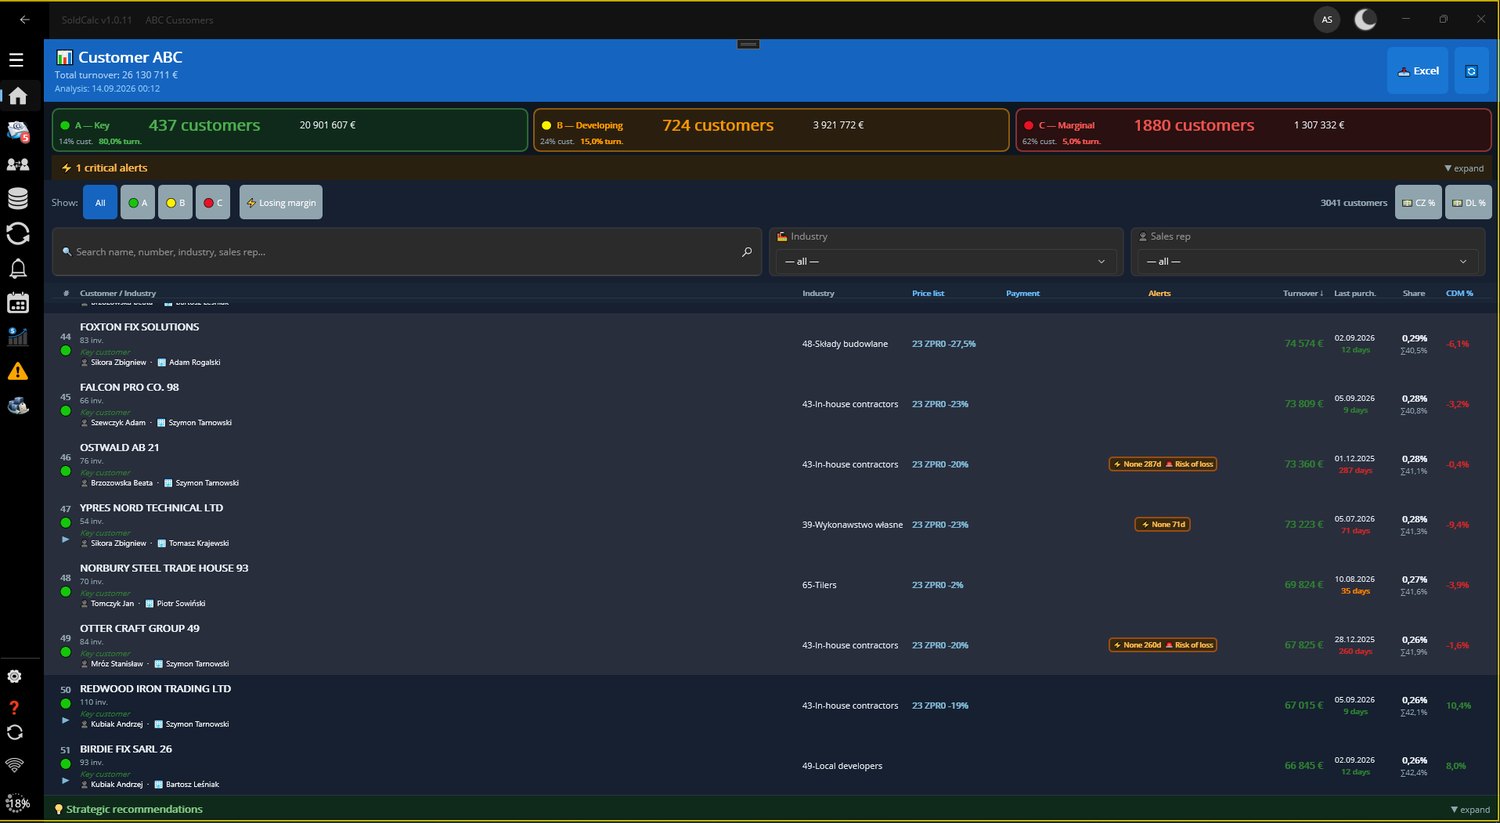
From the first sync SoldCalc works in the background: it aggregates sales, classifies customers (ABC and behaviour patterns), detects margin leaks and calculates forecasts. Nobody has to "run the analysis" — the results are simply waiting for people.
- ABC classification of customers and products plus behaviour profiles (growing, declining, price-shopping…)
- 19 Margin Recovery rules scan sales for margin leaks
- Quarterly forecasts: history + seasonality + the reps' knowledge
Sales visit planning — on a map, not in a notebook
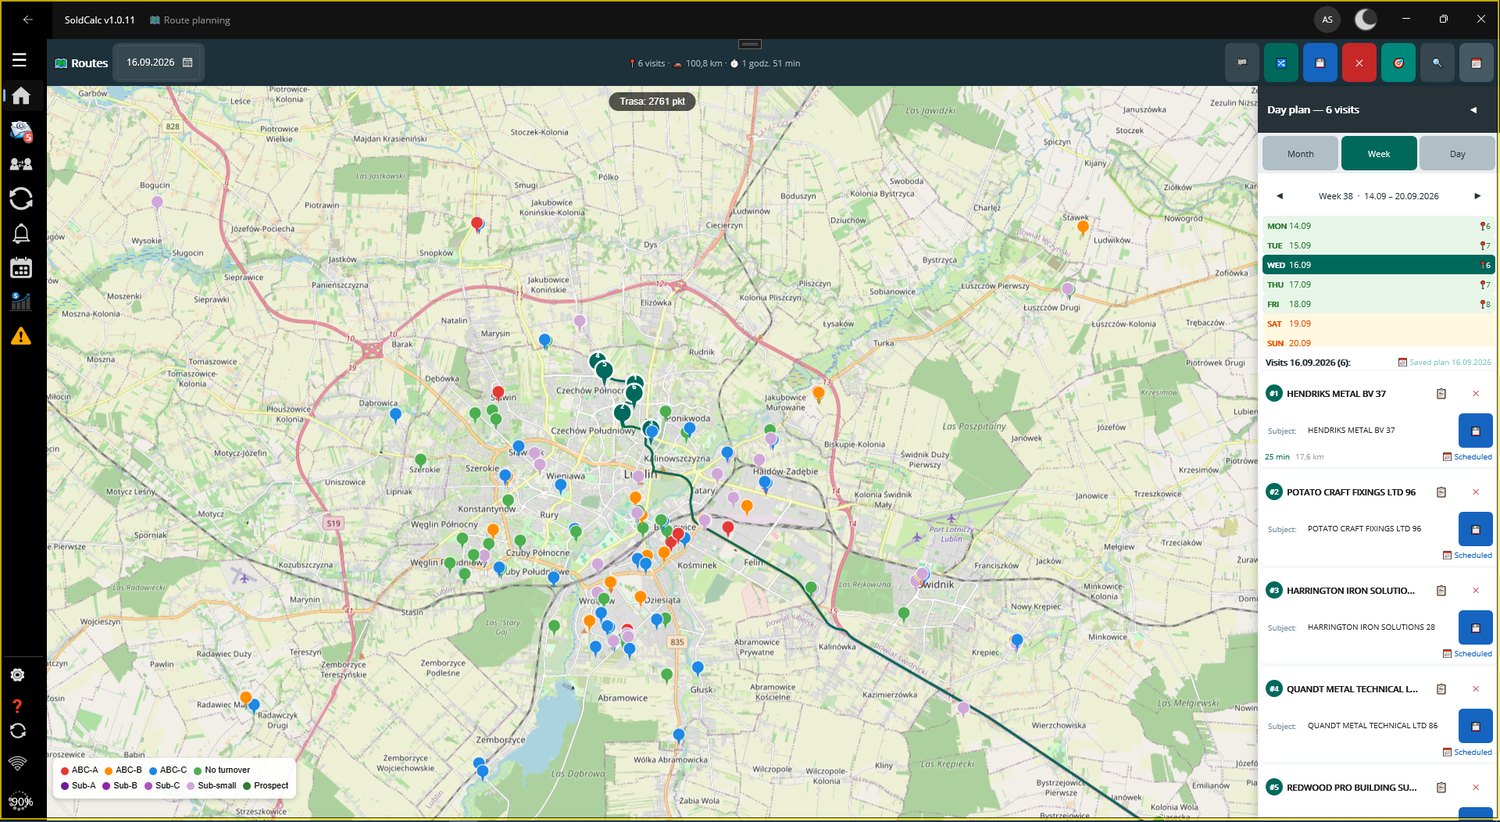
The rep opens the map: customers colour-coded by importance (ABC classes), plus a visit calendar and route planning. Priorities come from the feed — a list of actions derived from data, not gut feeling.
- Customer map with pins by ABC class and turnover, filtered by region and industry
- Visit calendar with route optimisation
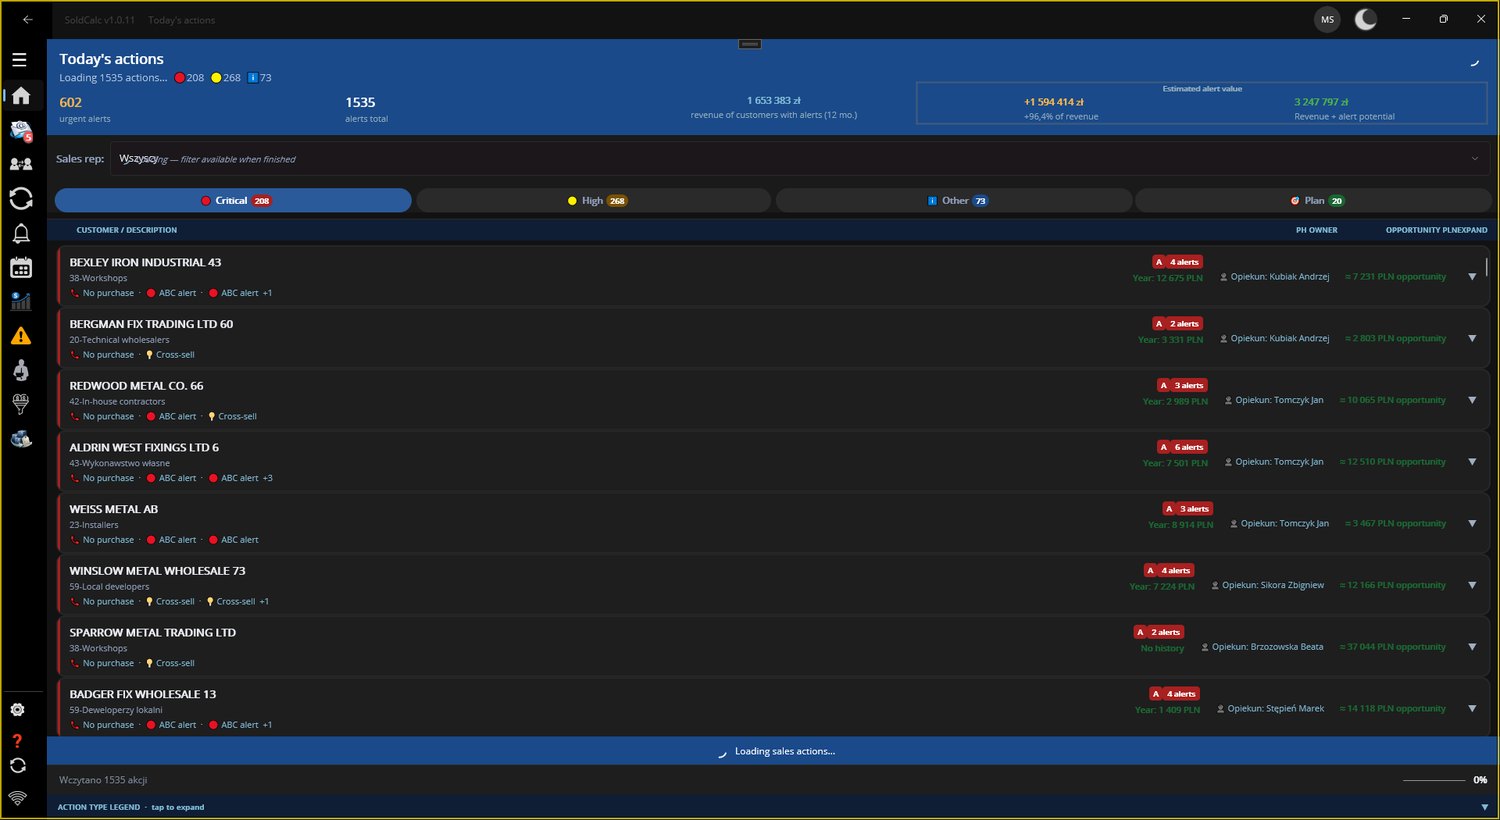
- "Actions for today": whom to visit and why — with the opportunity amount
At the customer: offer, competitive interview, notes — all in one, offline too
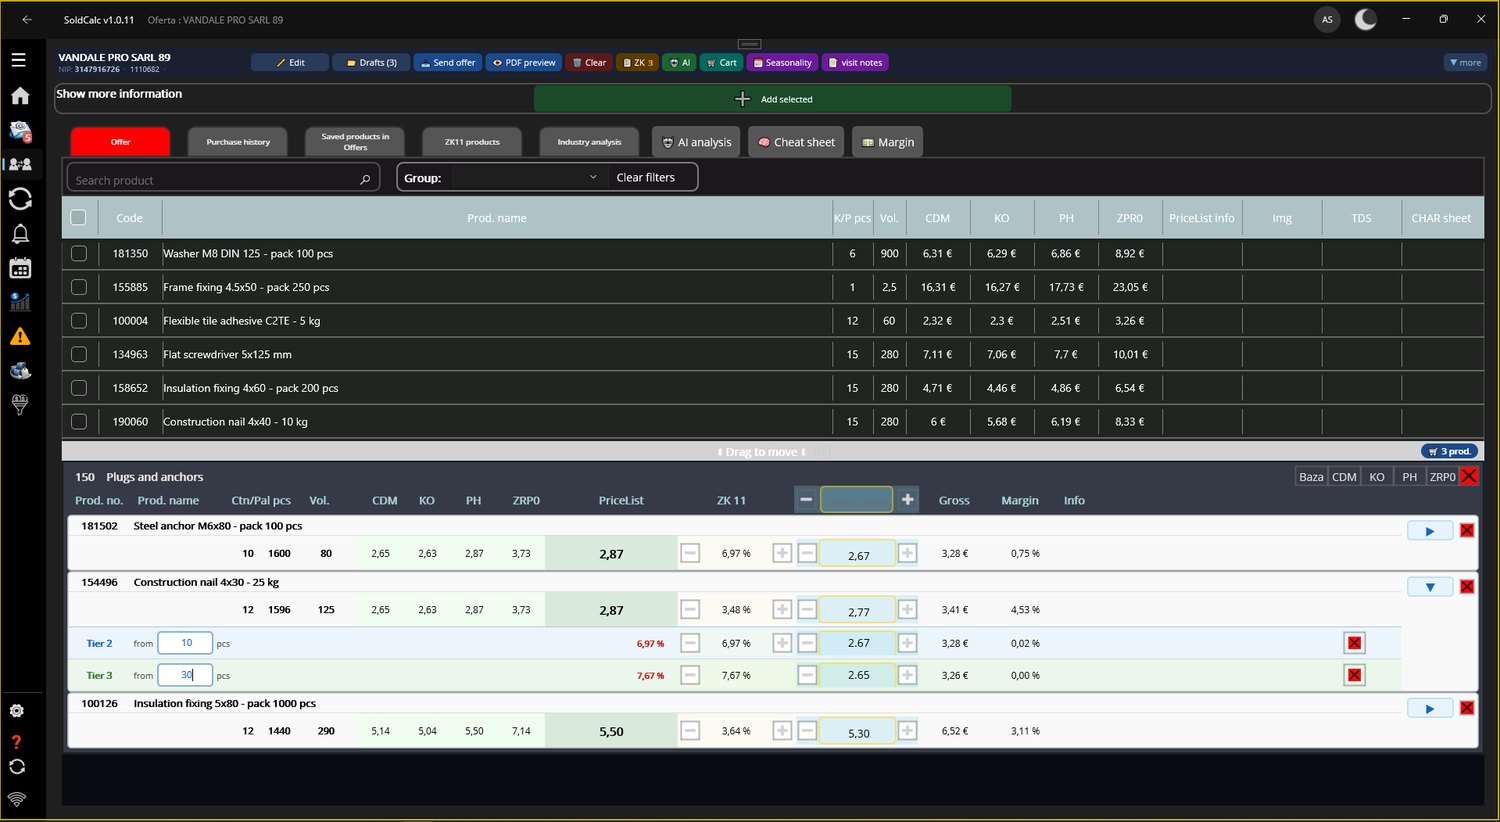
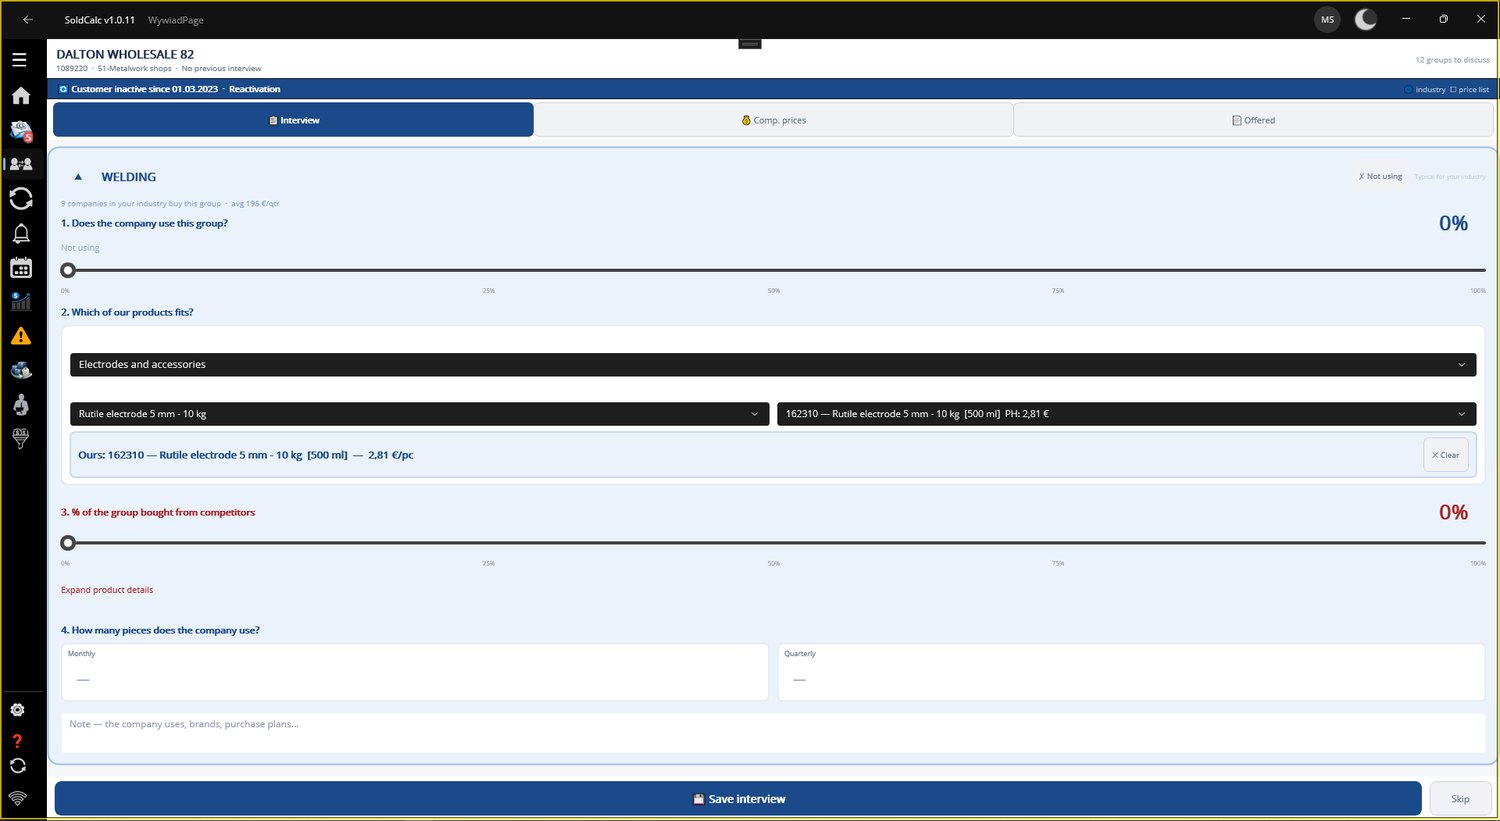
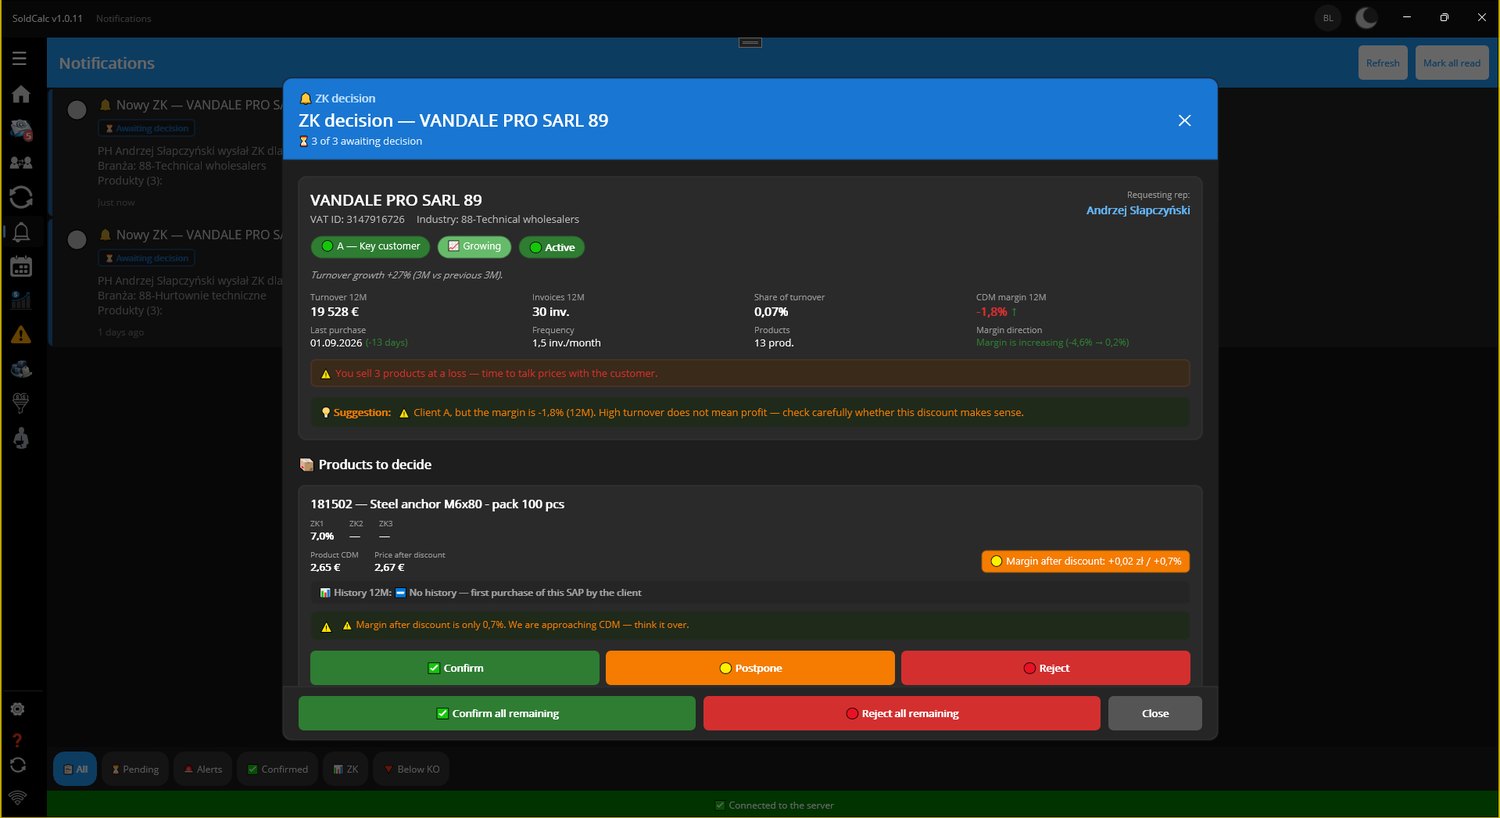
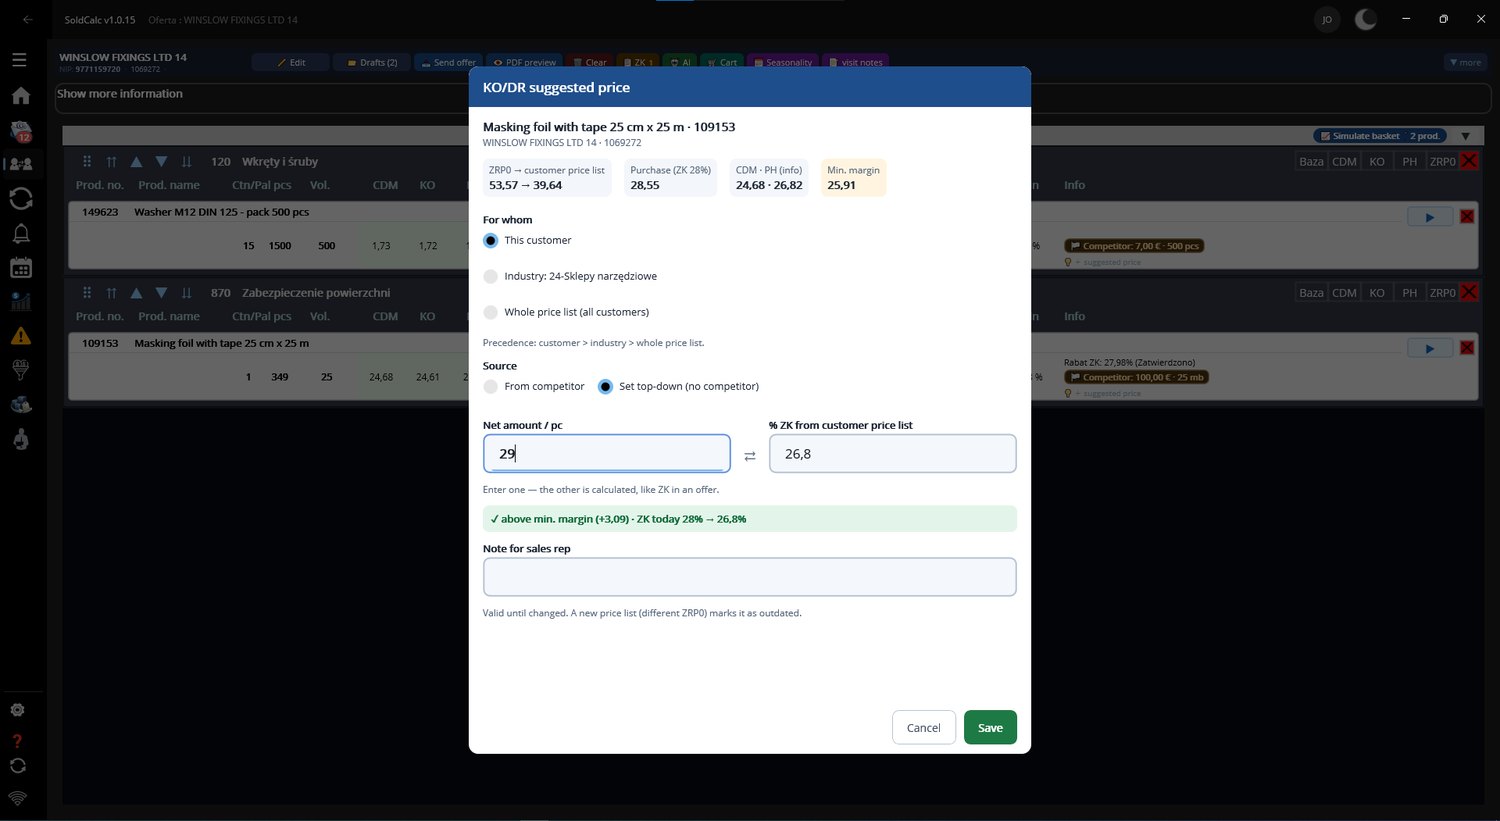
On site the rep has the customer card (offline!): purchase history, product proposals for this specific customer, prices and margins calculated live. They build the offer, and when a deeper discount is needed — the request goes to the manager and comes back with a decision before the coffee is finished. Along the way they note competitors' prices.
- An offer with an automatic price cascade and a PDF e-mailed on the spot
- Discount request → manager's decision in real time (push notifications)
- Competitive interview: what the customer buys elsewhere and for how much
- Everything saves locally and syncs to the API once back in coverage
- The manager’s suggested price shows up directly in the offer — together with the note explaining it
- An offer status on every line: price OK, too high, wants a sample, staying with the competitor — plus the competitor price and a note
Profitability, competition and forecasts — the company picture for managers and directors
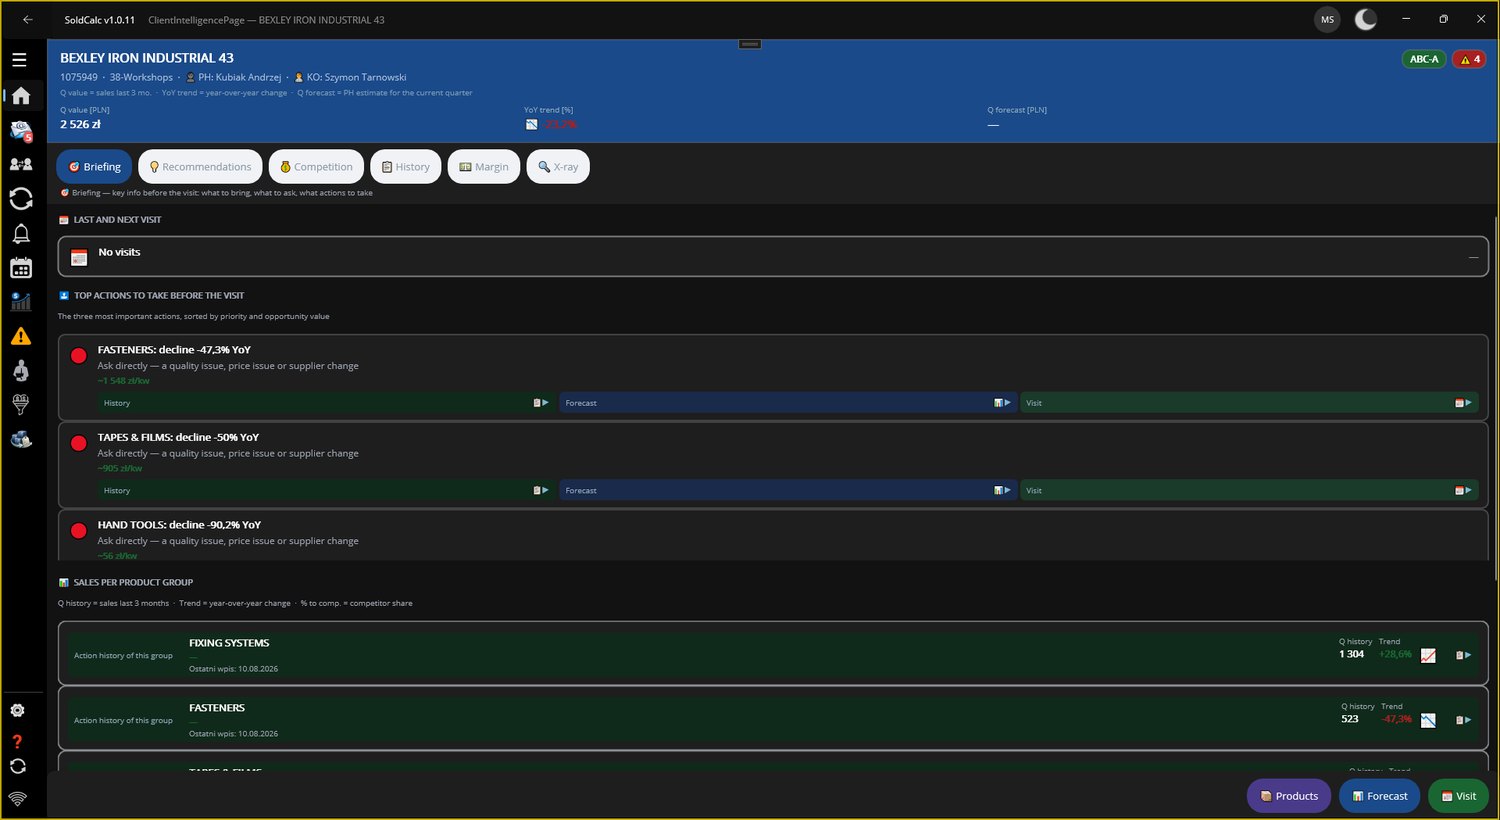
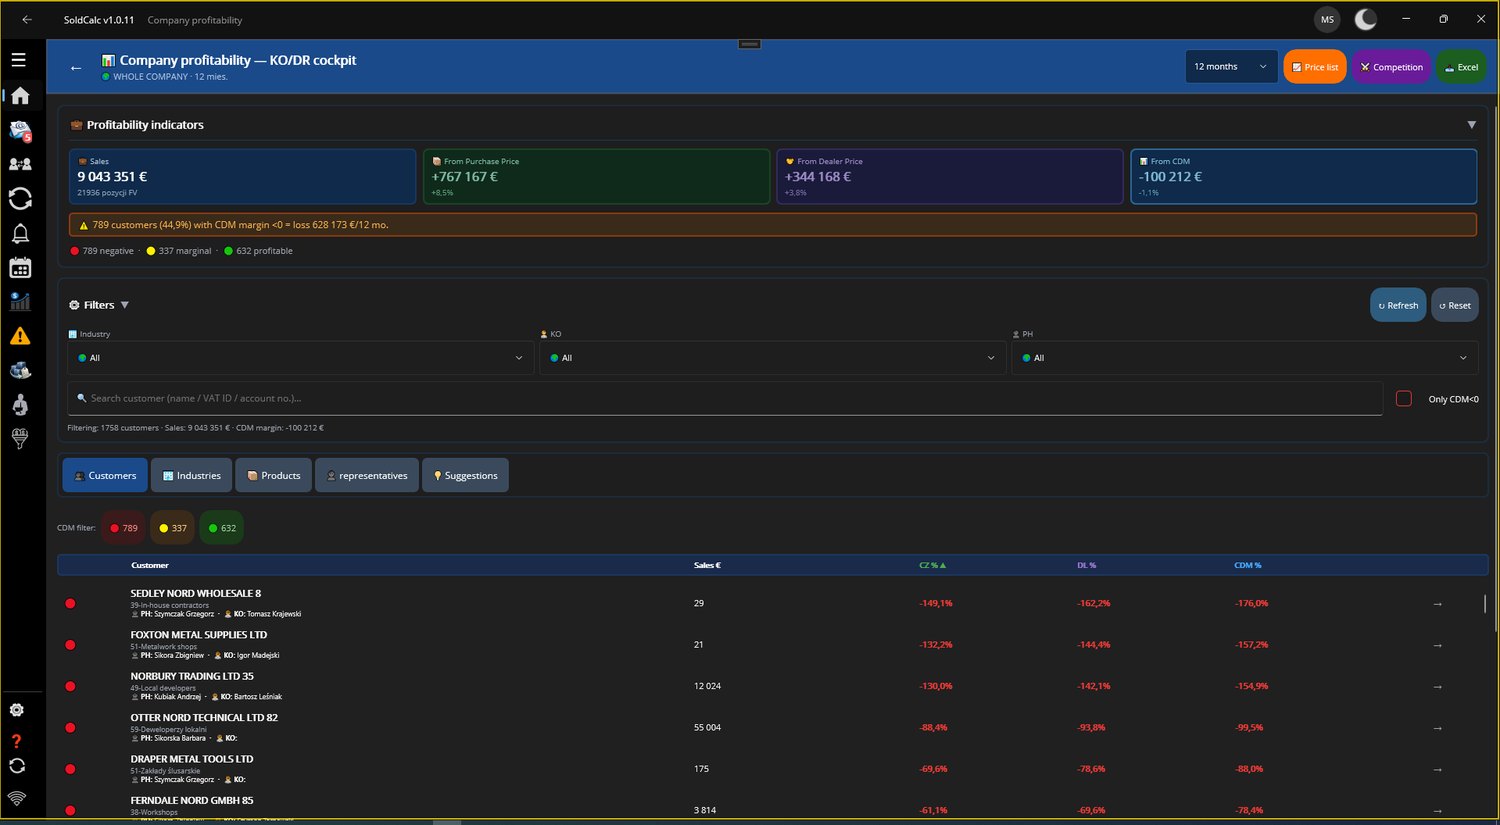
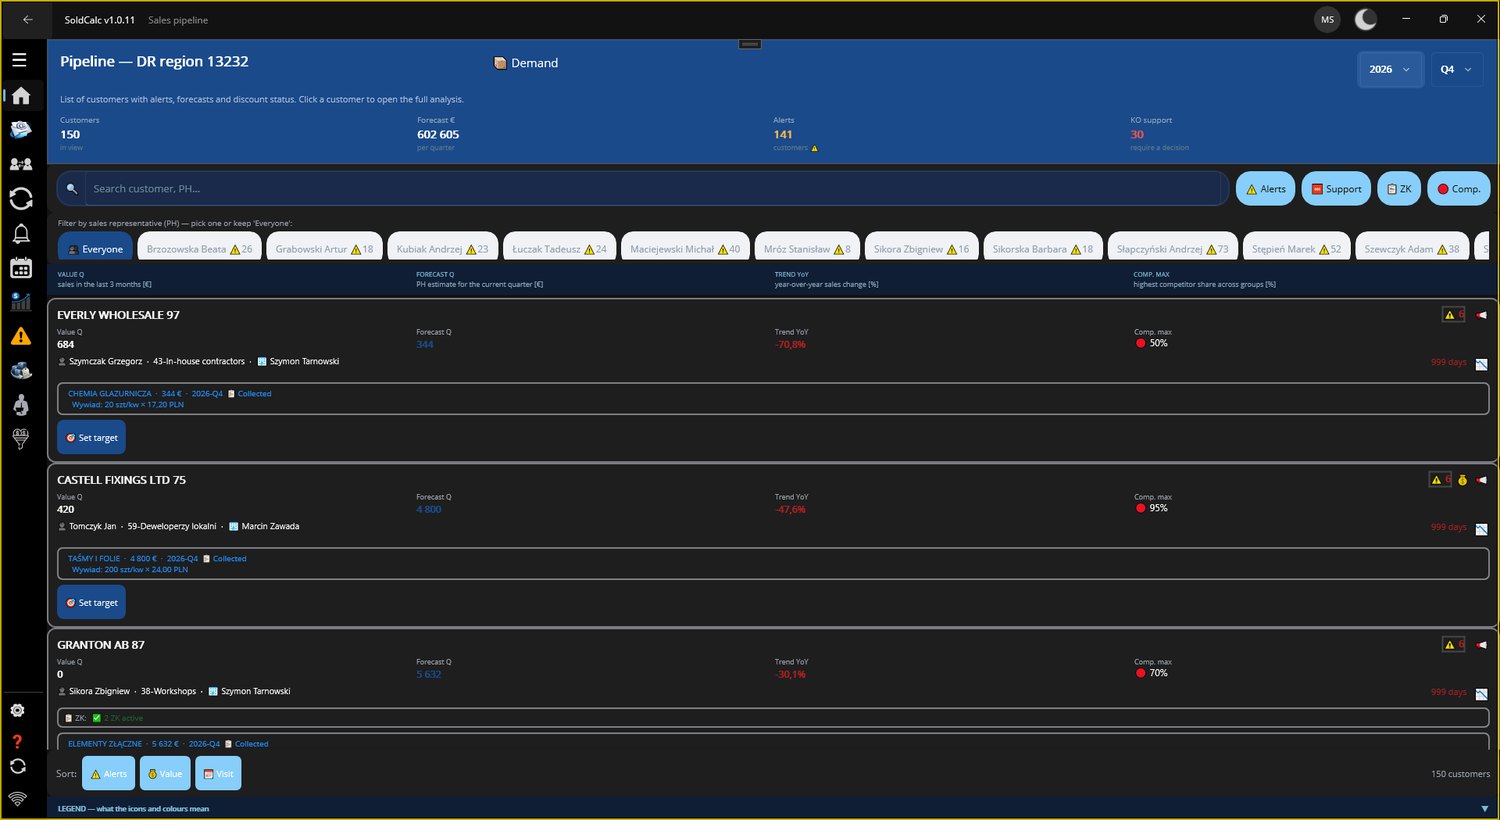
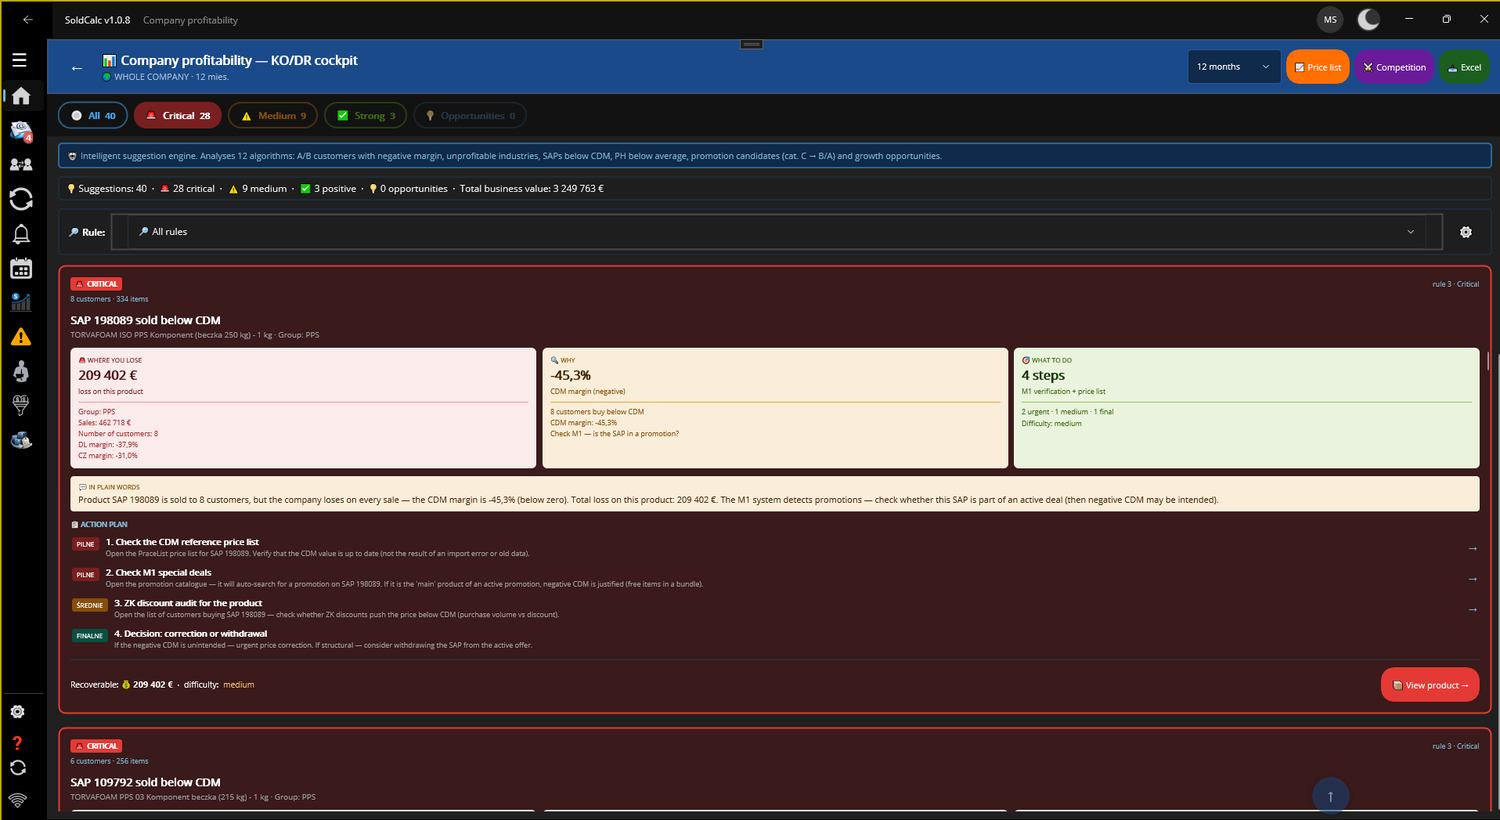
What the reps collected — sales, offers, interviews, visits — flows into the API and is aggregated by role. The manager gets the team's priorities and discount requests to decide. The director sees the cockpits: profitability, competition, price-change impact — with amounts, not decorative charts.
- Manager: customer pipeline with alerts, discount approvals, rep support
- Director: profitability cockpit with "Where you lose / Why / What to do" cards
- Competition cockpit: how much is leaking and where — based on field interviews
- Everyone sees exactly what their role allows: rep → manager → director
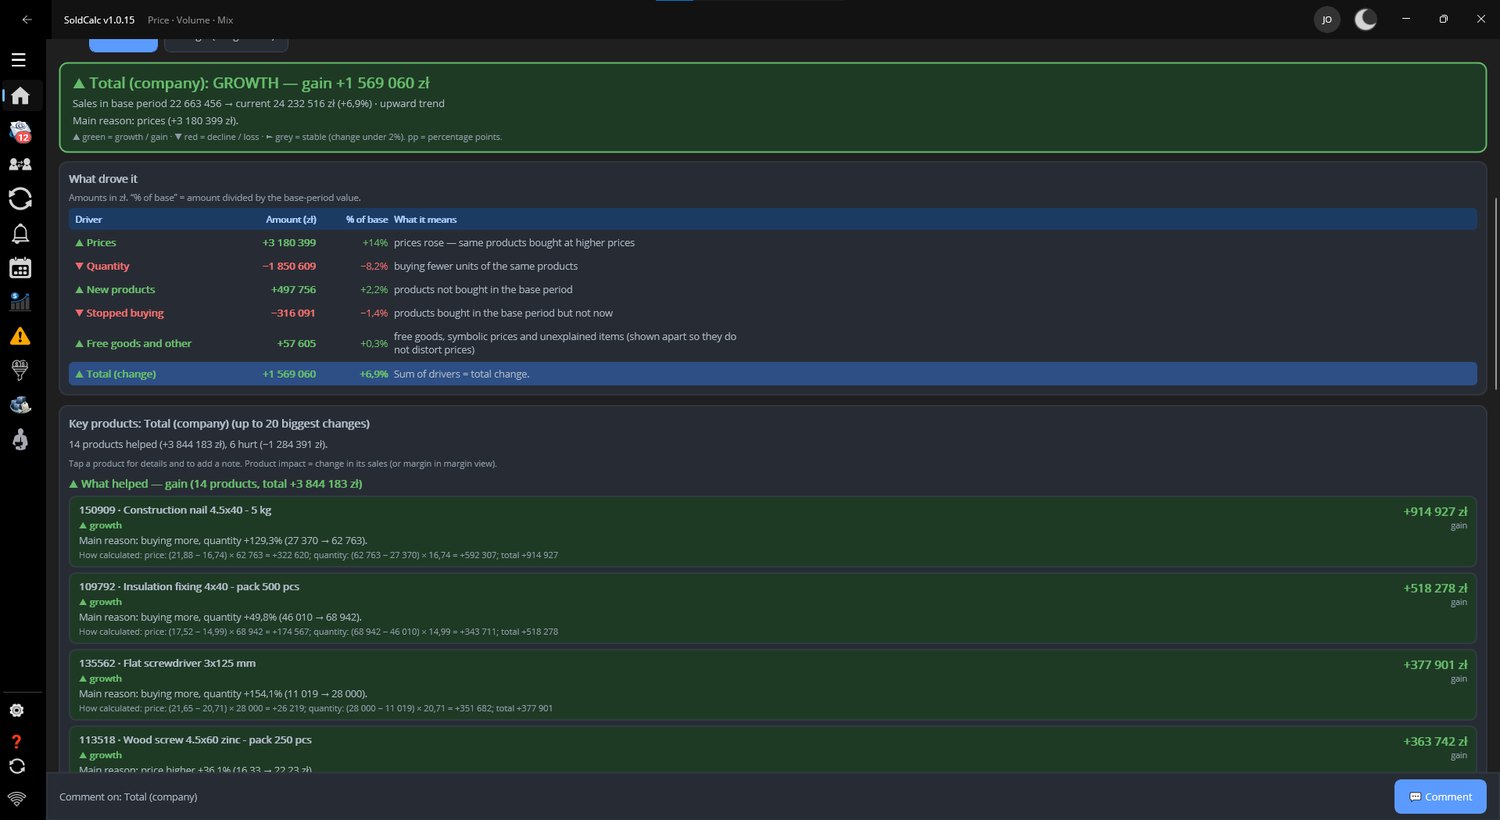
- The change in turnover and margin broken down by cause: price, quantity, new products, dropped products, free goods — per company and per rep
- Client profitability simulator: what happens to the margin if you change a price or the make-up of the basket
The next morning the rep's feed already knows what happened yesterday.
The manager's decisions, new interviews, ABC class changes, detected leaks — everything comes back into "Actions for today" as concrete, prioritised tasks. And at month-end the board sees which actions really translated into sales and margin. No collecting reports, no "prepare me a summary for Monday".
Want to see this loop on your company's data?
The pilot programme follows exactly this path — from loading your Excel to the "how much SoldCalc found" report.
Book a Proof of Value →