
How much money is your company losing, before anyone notices?
SoldCalc finds the places where sales look fine — but margin, a customer or basket share is quietly slipping away.
Not another dashboard. A system that shows: where you lose, why, how much it costs and what to do.
You don't need another dashboard. You need answers.
SoldCalc leads from the number to the cause — and from the cause to a concrete action.
Sample signal: a product sold below its proper profitability level.
Sample value of the area that needs action — figures on this page are for demonstration.
The system doesn't stop at detecting a problem. It turns it into an action plan.
All values on this page are examples. In a Proof of Value the same mechanisms run on your company's data.
Customer X — a sample analysis scenario
No decision is still a decision. Usually the most expensive one.
A sales problem rarely appears overnight. For months it can look like a few small deviations: a discount, a price, a dip in share, a smaller basket.
The customer still buys
At first glance everything looks normal.
The problem is bigger
A competitor takes part of the basket and margin drops.
Winning back the position costs more
The later you react, the fewer decisions stay simple.
Your company probably already has this data.
The problem is that nobody connects it into one picture.
See how SoldCalc works
The problem
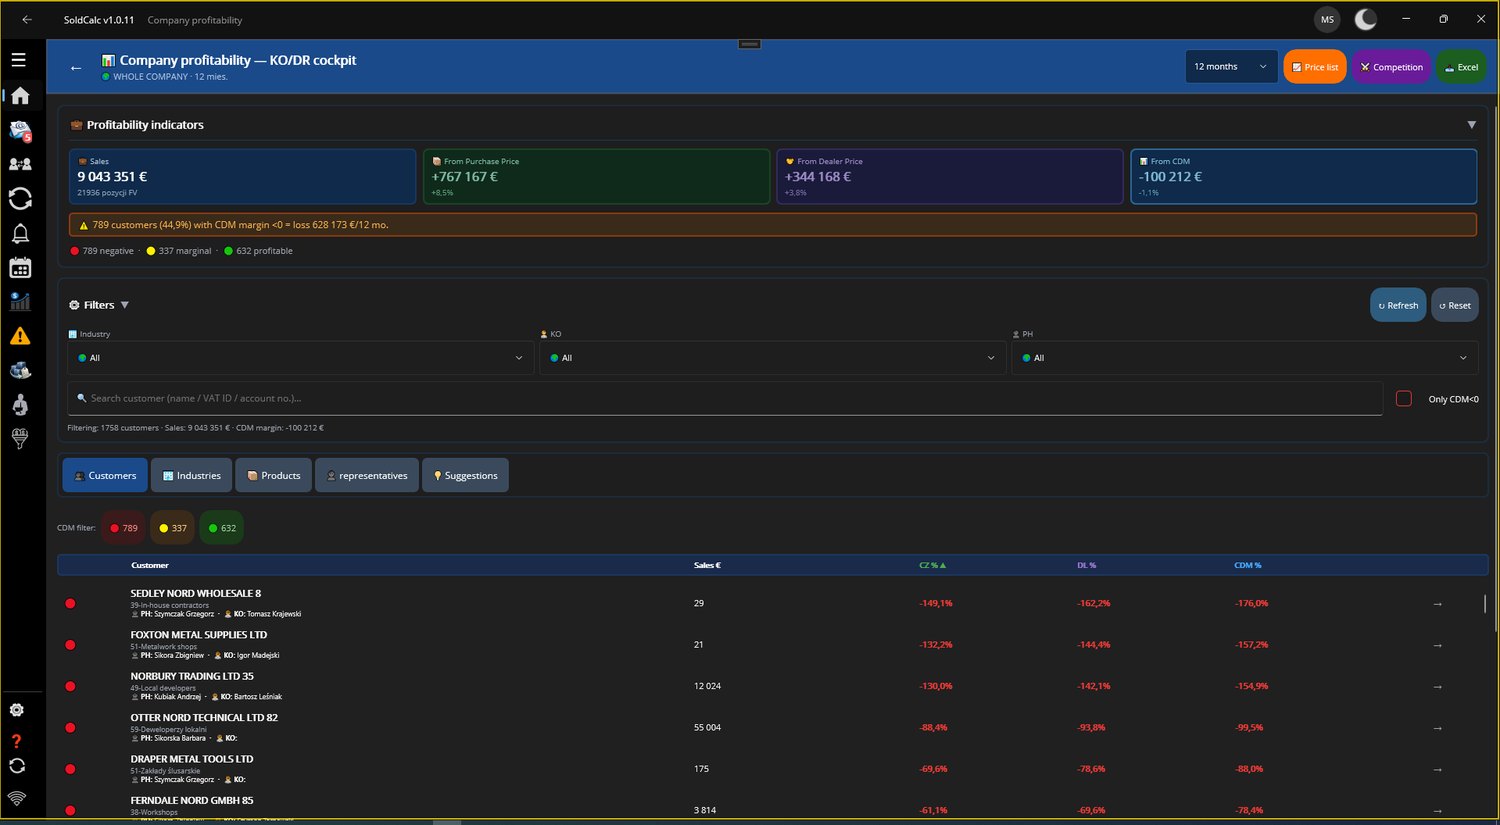
Margin is falling. But why? A product sold at a −22.3% margin — sales look normal, profitability doesn't.
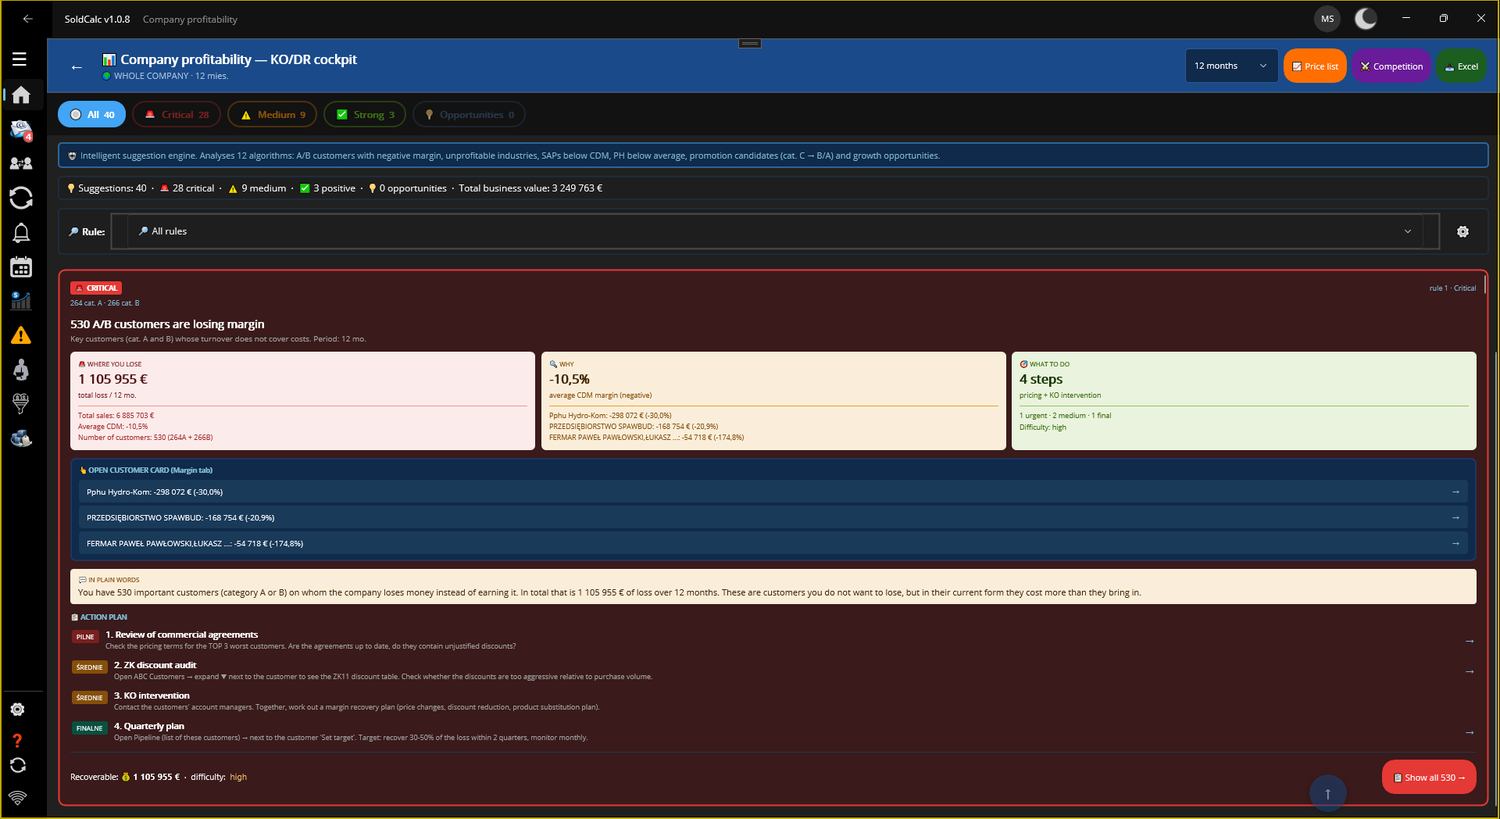
SoldCalc looks for the cause
Price, discount, competition, sales structure, customer — the system connects price, volume, discount and margin to point at the source of the problem.
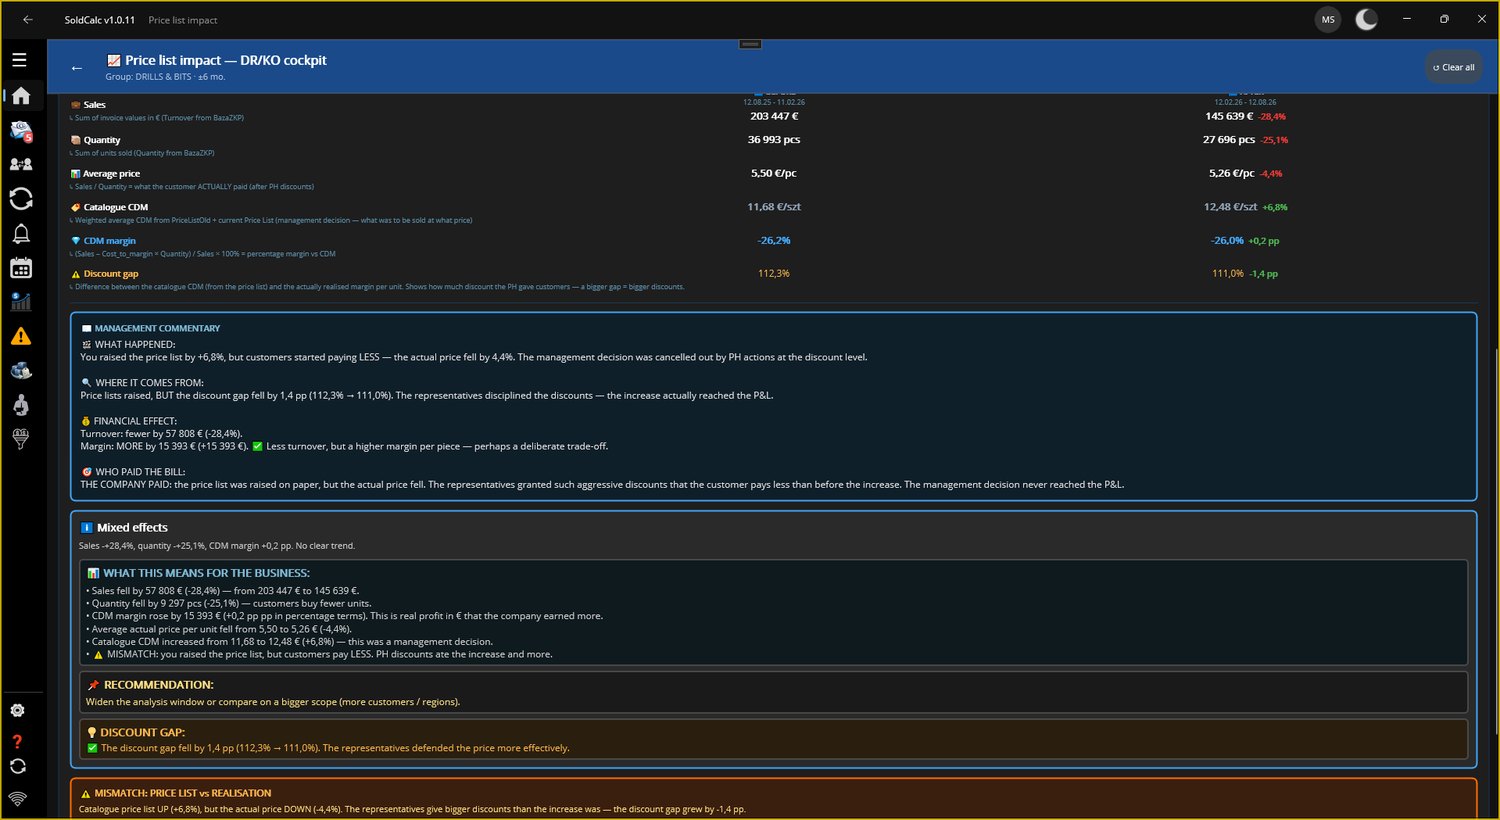
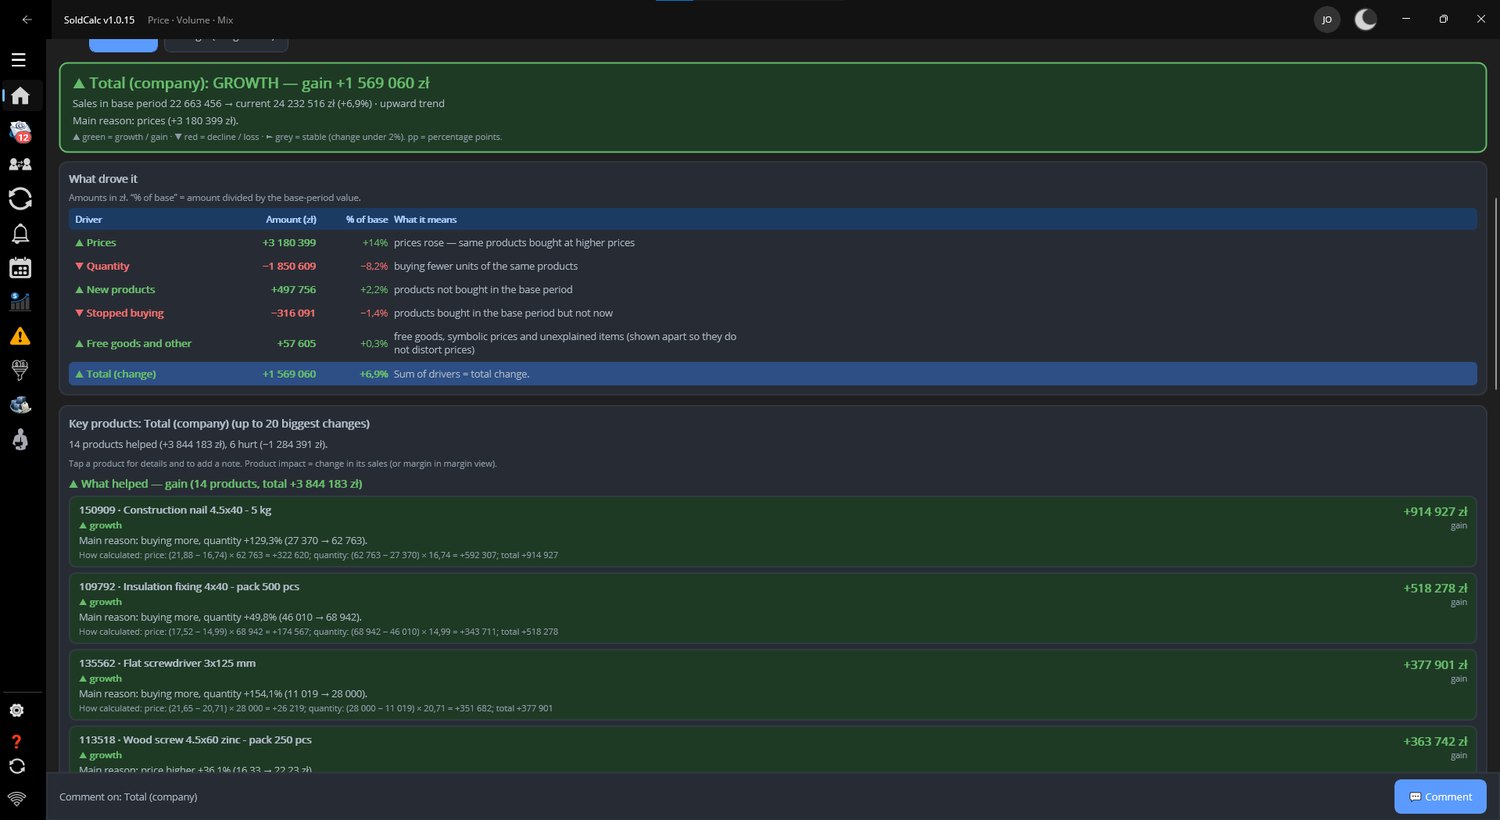
It breaks the change down into causes
Turnover is up by 1.57 m — but why? SoldCalc splits every change into five causes: price, quantity, new products, products the customer stopped buying, and free goods. The amounts add up to the total, so you can see what actually worked — and with whom.
It calculates the financial impact
Not "a KPI dip" — a concrete amount the board can talk about.
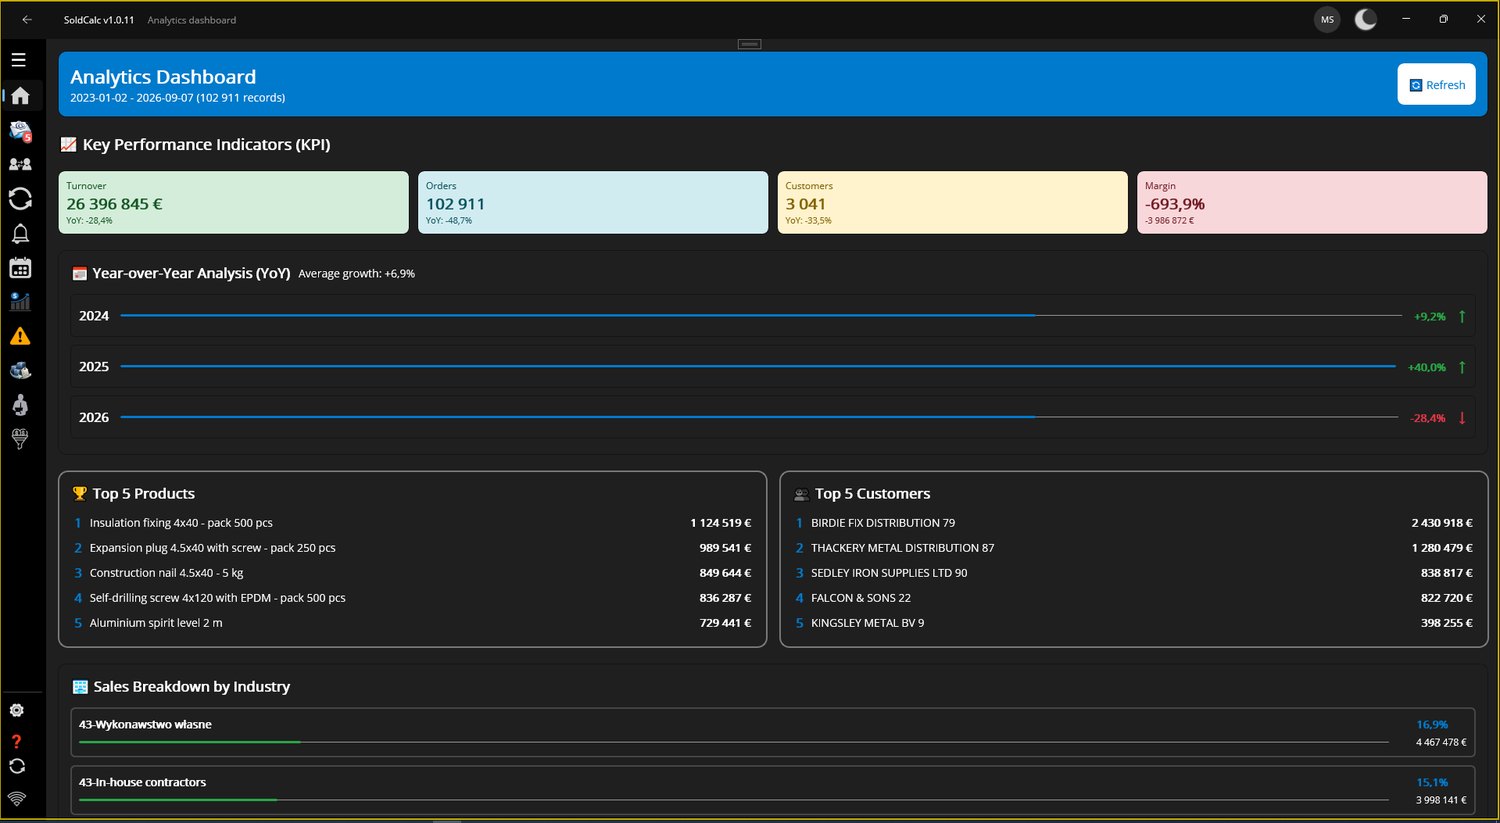
It points at customers and products
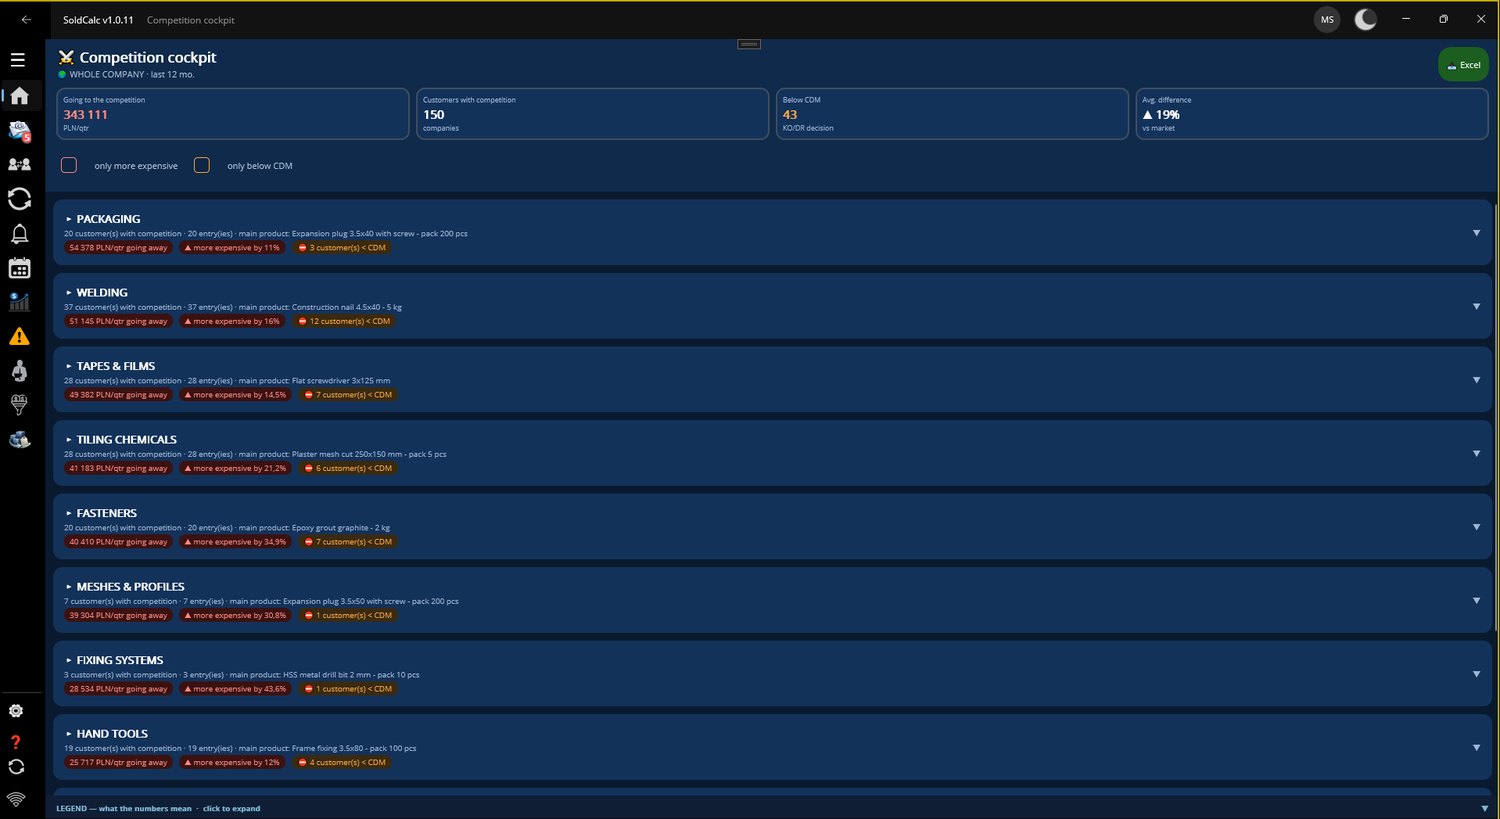
The competitor is already inside. The system shows the products and customers where the competitor is taking share.
It creates the action
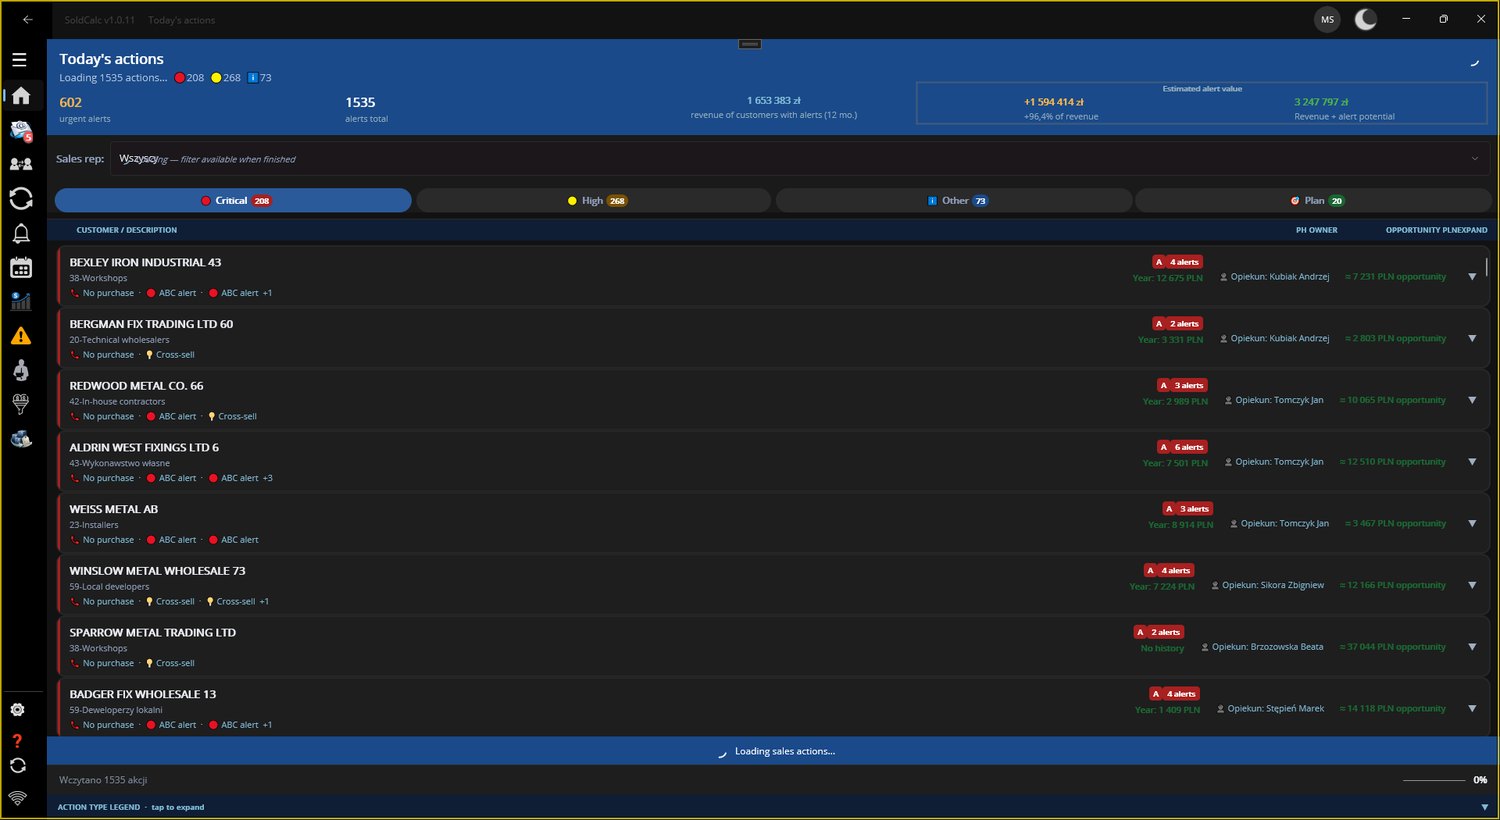
Problem found. Now what? Not just "problem found" — the rep gets a task with a priority, an opportunity amount and a deadline.
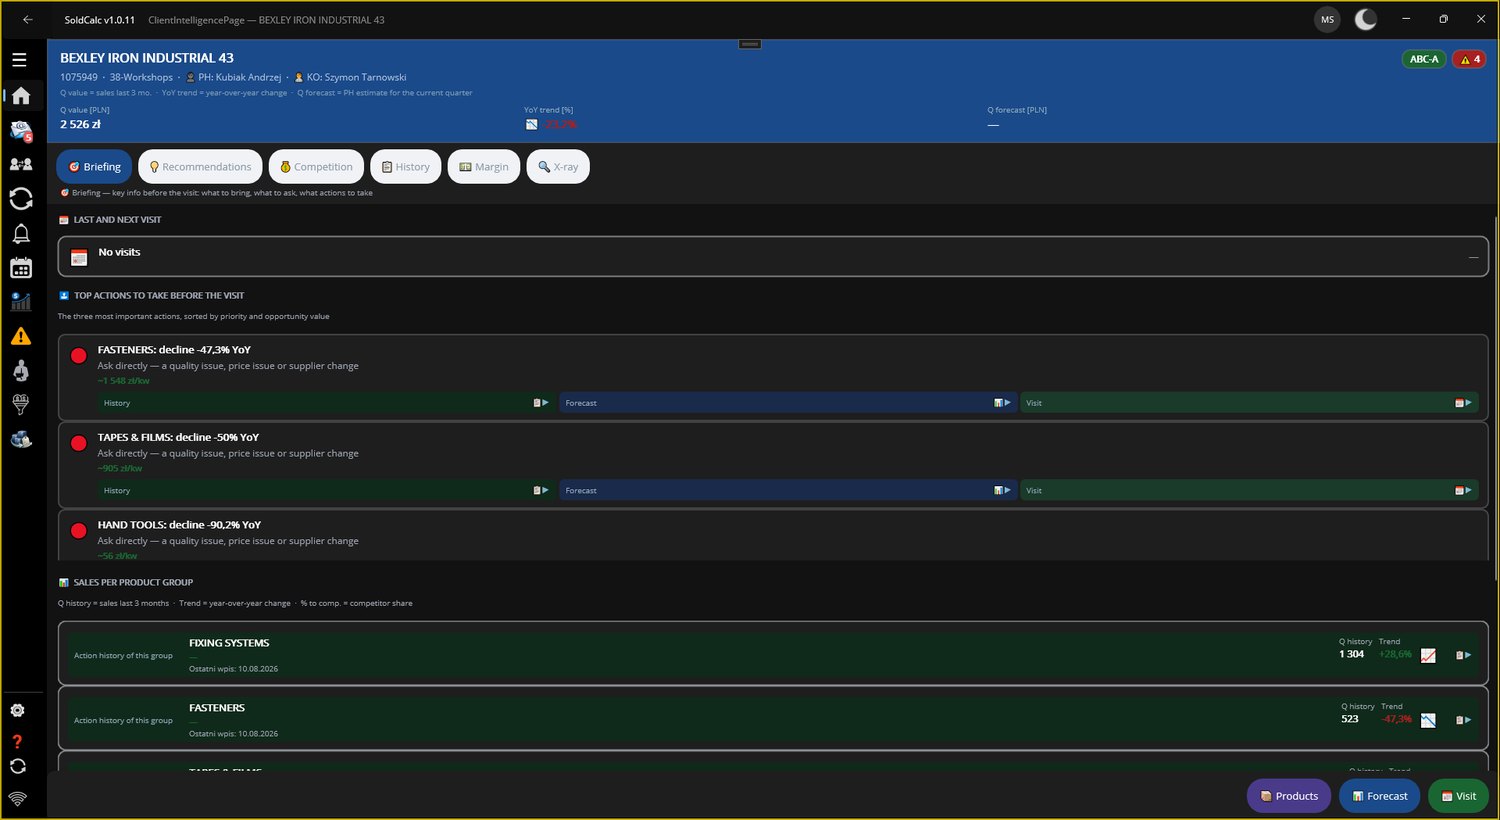
It pulls together everything about the customer
One screen instead of clicking through five tabs: profitability, trend, potential, relationship and risk on a single line — and below them the price conditions, the discount history, what the competitor is doing and what to do about it. The rep prints the same thing as a customer card before a visit.
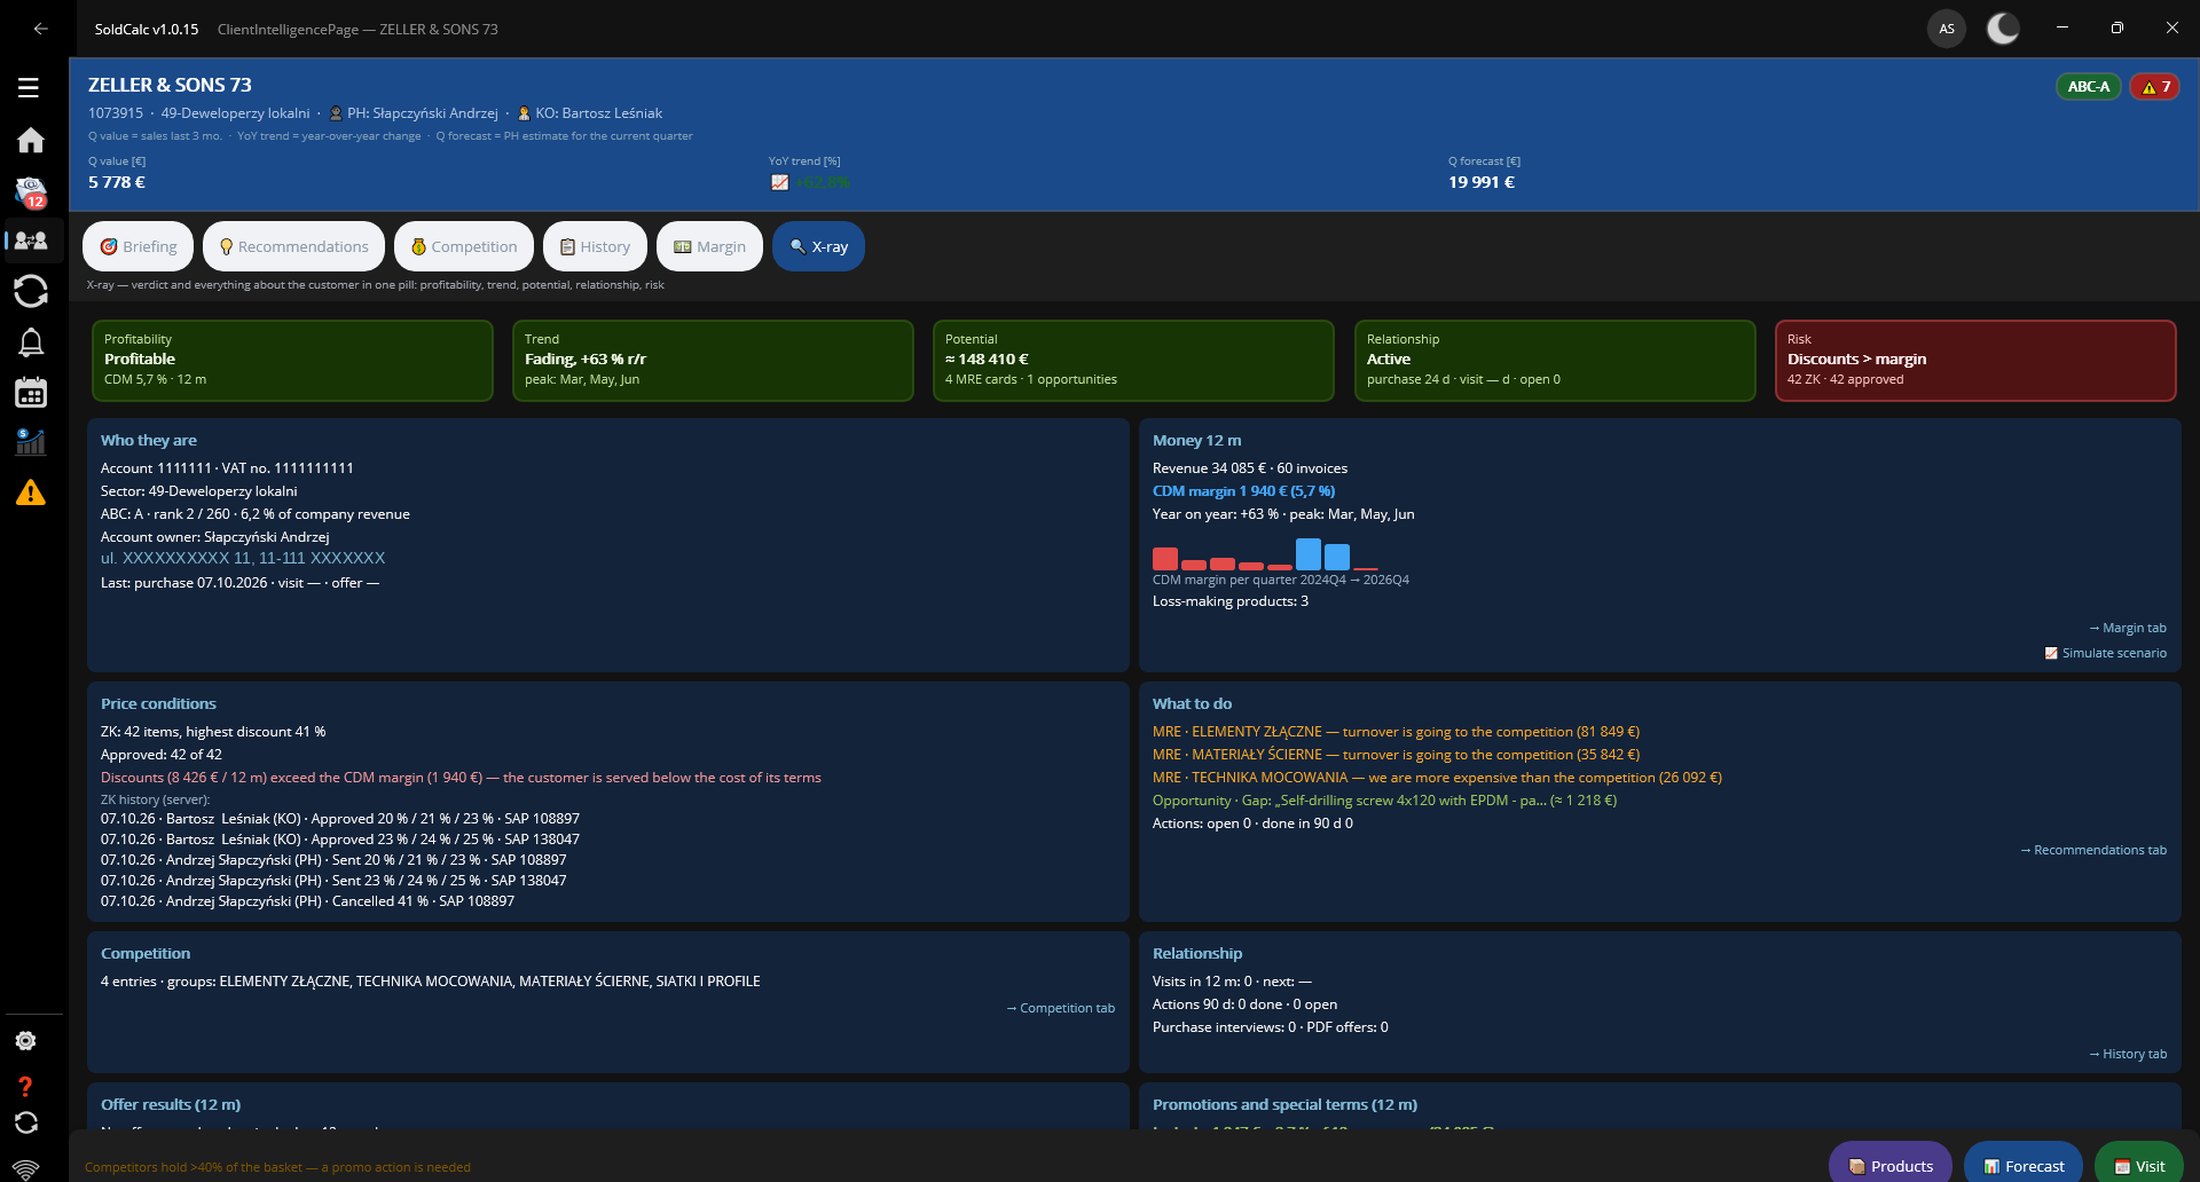
Exactly this kind of report — on your data — is how the pilot programme ends.
I want this report for my company →And this is exactly why SoldCalc is not another BI dashboard
| Type of tool | What does it show? | What does SoldCalc add? |
|---|---|---|
| CRM | customer, contact, activity | analyses customer value |
| ERP | transactions | hunts for deviations and losses |
| BI | charts and KPIs | points at the cause |
| Excel | manual analysis | automates the analysis |
| SoldCalc | problem → value → action | leads to a decision |
What may be hidden in your sales?
💰 Leaking margin
The customer buys more and more, but you earn less and less. SoldCalc keeps scanning your sales and shows where profitability is escaping — with a concrete amount to recover.
- 19 leak-detection rules: discounts, sales below thresholds, fragmented orders
- A "Where you lose / Why / What to do" card with a ready action plan
- Every discount goes through approval — a full decision trail
🥊 Growing competition
You know the customer is buying. SoldCalc shows what they stopped buying from you and where a competitor stepped in.
- Competition cockpit: the amount leaking to competitors each quarter, per product group
- An alert when the expected price falls below the profitability threshold
- Field interviews turned into comparable data — not notes
📉 Customers you are starting to lose
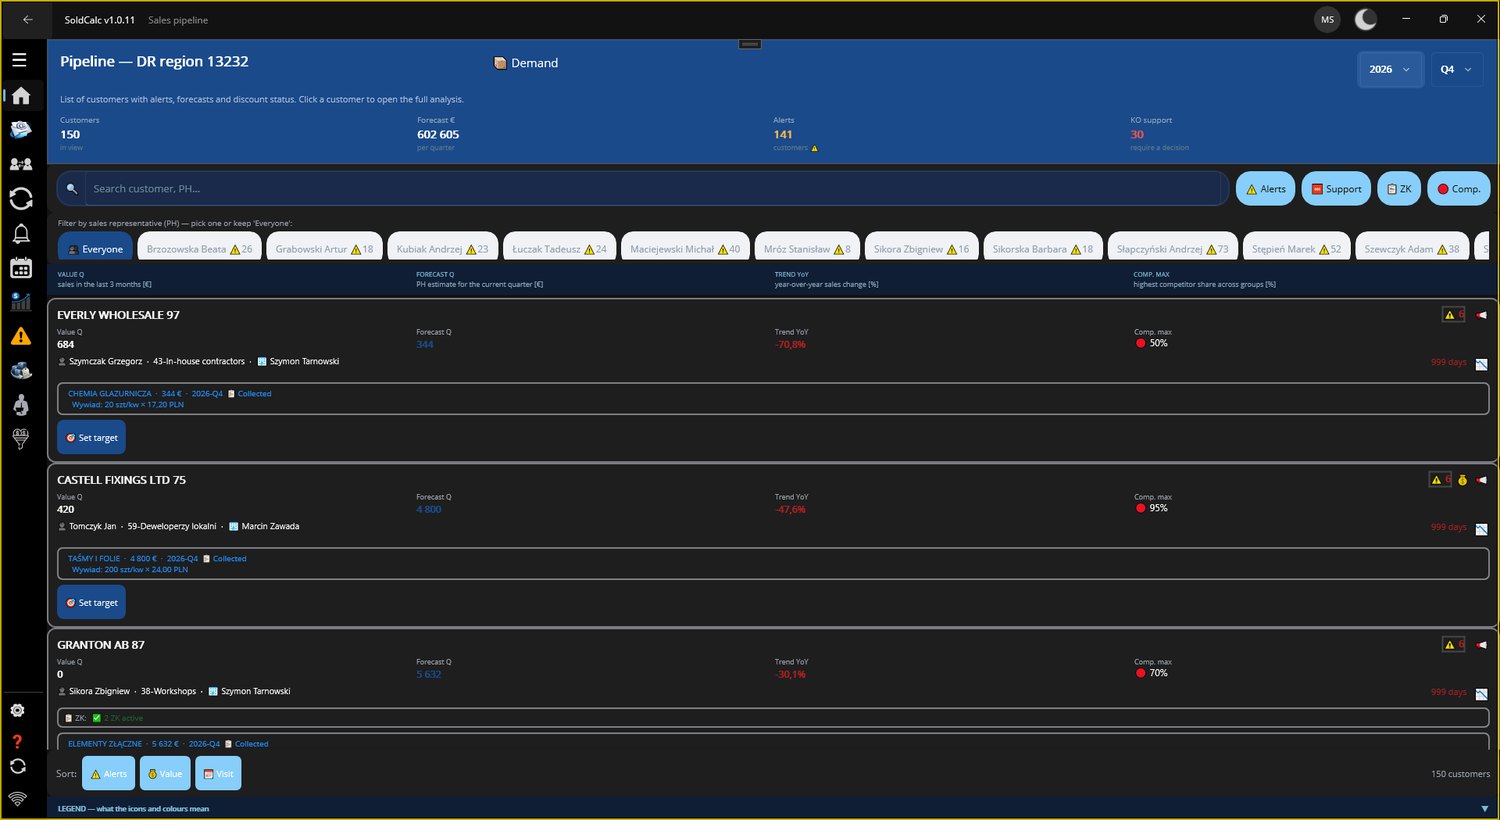
Sales don't look dramatic yet. But the trend has already turned — and the data shows it.
- Customer behaviour classification: growing, declining, price-shopping
- Pipeline for managers: where to step in before sales drop
- Alerts on ABC class changes and activity drops
🛒 Untapped basket
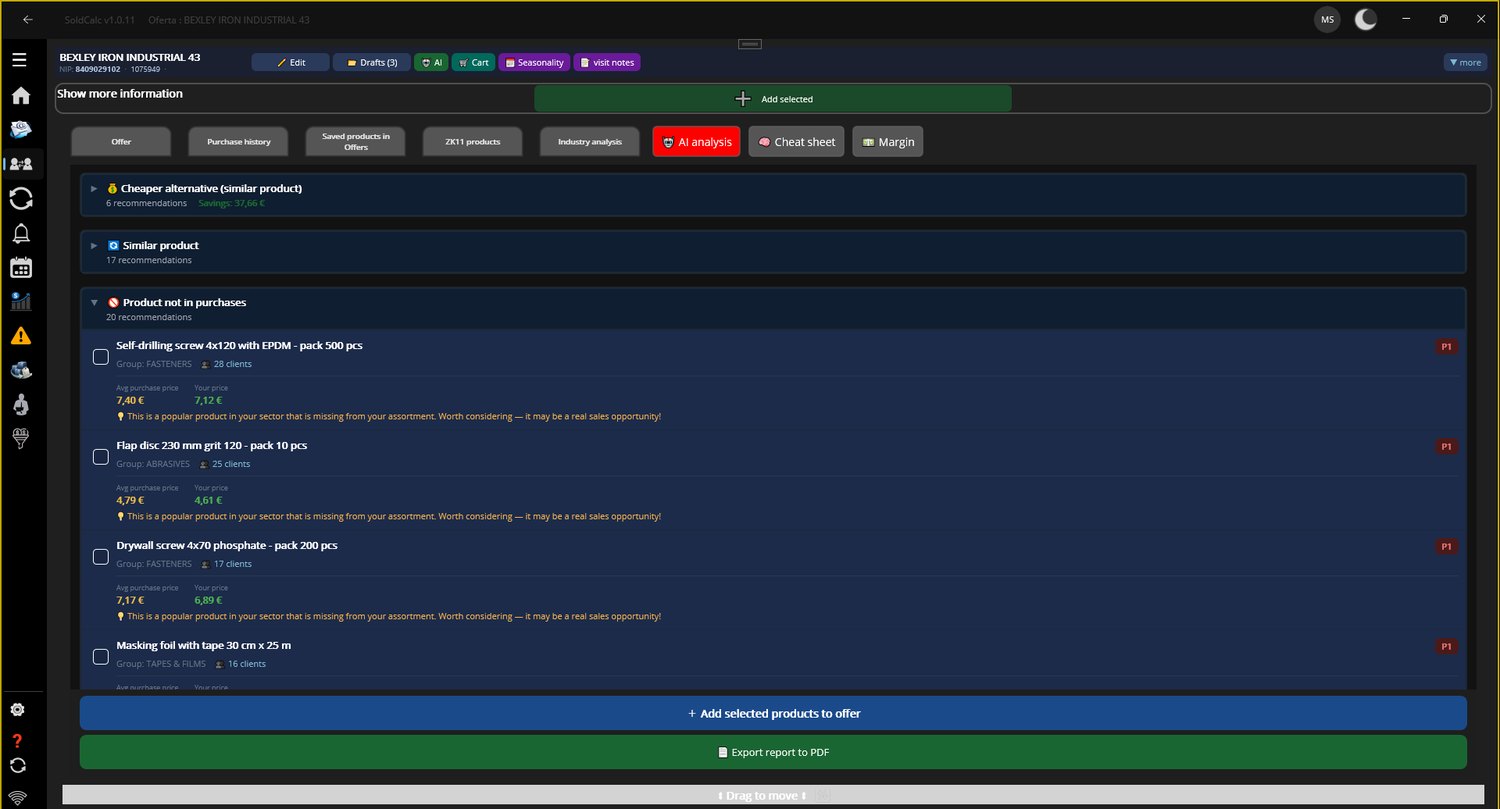
The customer buys product A. Similar customers also buy B, C and D. Cross-sell and basket analysis show what's missing.
- Individual product proposals per customer — from industry and purchase-history analysis
- Basket analysis: what naturally sells together
- The rep gets a ready list with potential and a recommended action
📆 A bad pricing decision
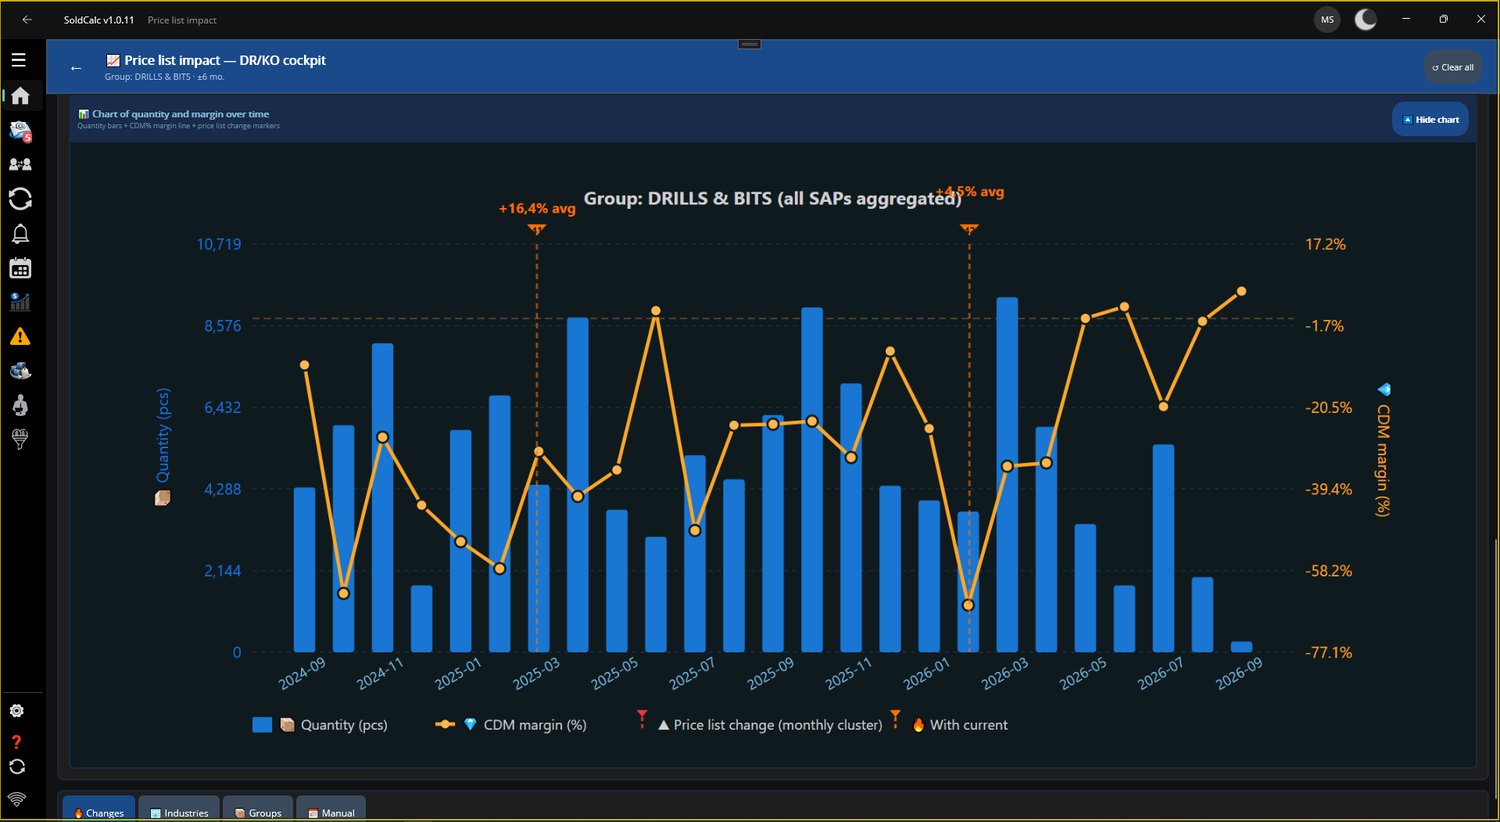
The price was changed. The volume stayed. The margin didn't. SoldCalc shows how the price change really performed.
- A "before / after" price-change comparison with management commentary
- Volume and margin over time, with price-change markers
- Historical price lists: a real "was / is" calculation
🔮 The future
What may happen next quarter if the trend continues? The board sees future revenue, not just history.
- Quarterly forecasts per customer and product group
- History + seasonality + the rep's field knowledge
- Targets and execution tracking for managers
All of this may already be sitting in your data.
The analysis is half the journey. The other half happens at the customer.
The same data the board looks at comes back to the sales rep as the price they are allowed to give — and as a place to record what the customer actually said.
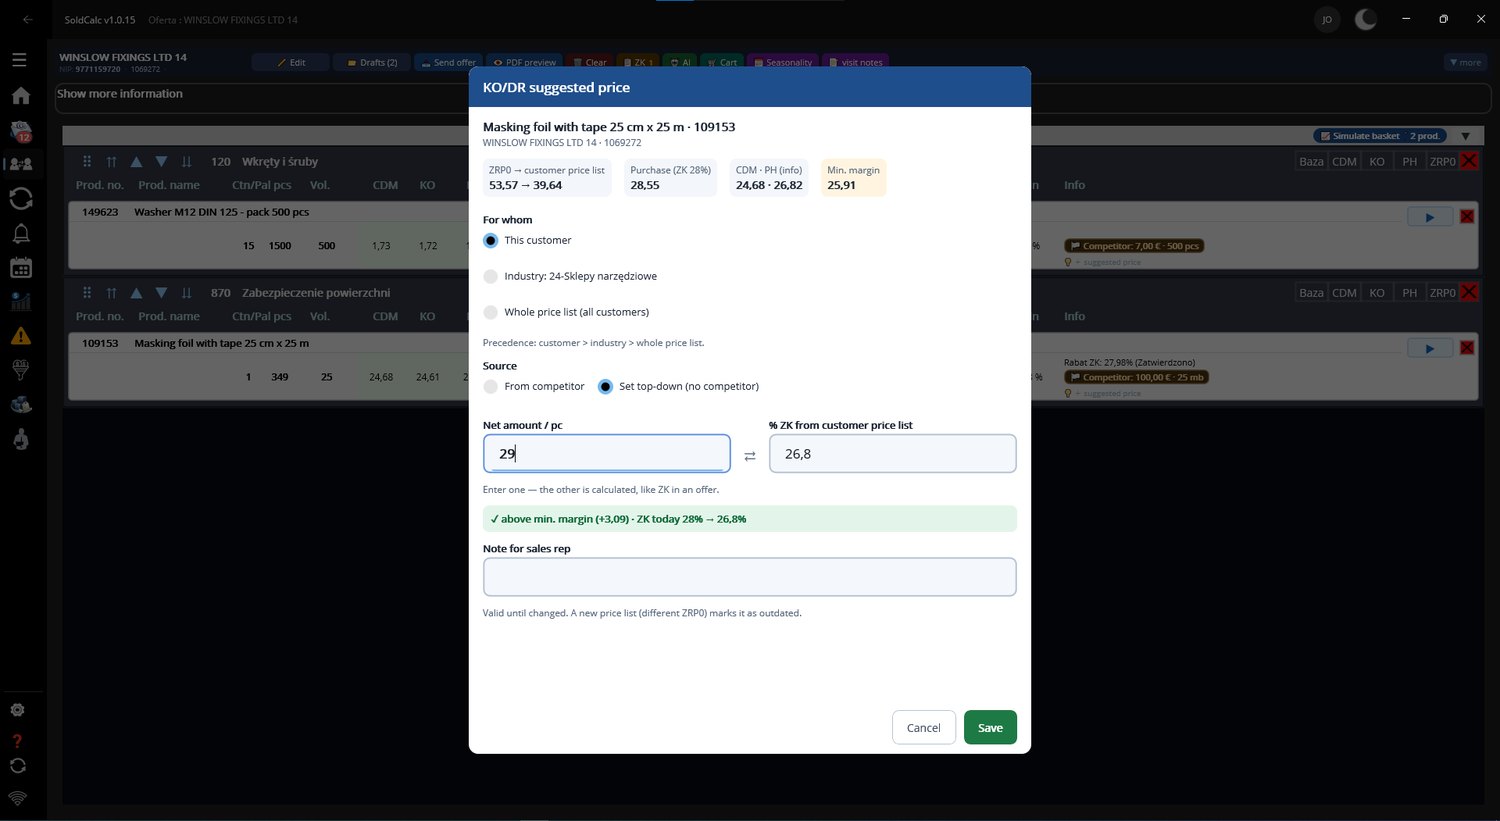
🎯 Suggested price — the manager sets it, the rep sees it
No more “how low can I go?” phone calls. A manager or director records a target price for one customer, for a whole industry or for the entire price list — and the rep sees it right in the offer.
- While setting it you see the full picture: purchase price, the customer price list, the CDM · PH range and the minimum margin
- Enter an amount or a ZK percentage — the other one is calculated for you, with the headroom above the minimum margin shown at once
- Precedence: customer → industry → whole price list; a new price list marks the old suggestion as outdated
- A note for the rep travels with the price — why this number
📋 Offer status — what the customer actually said
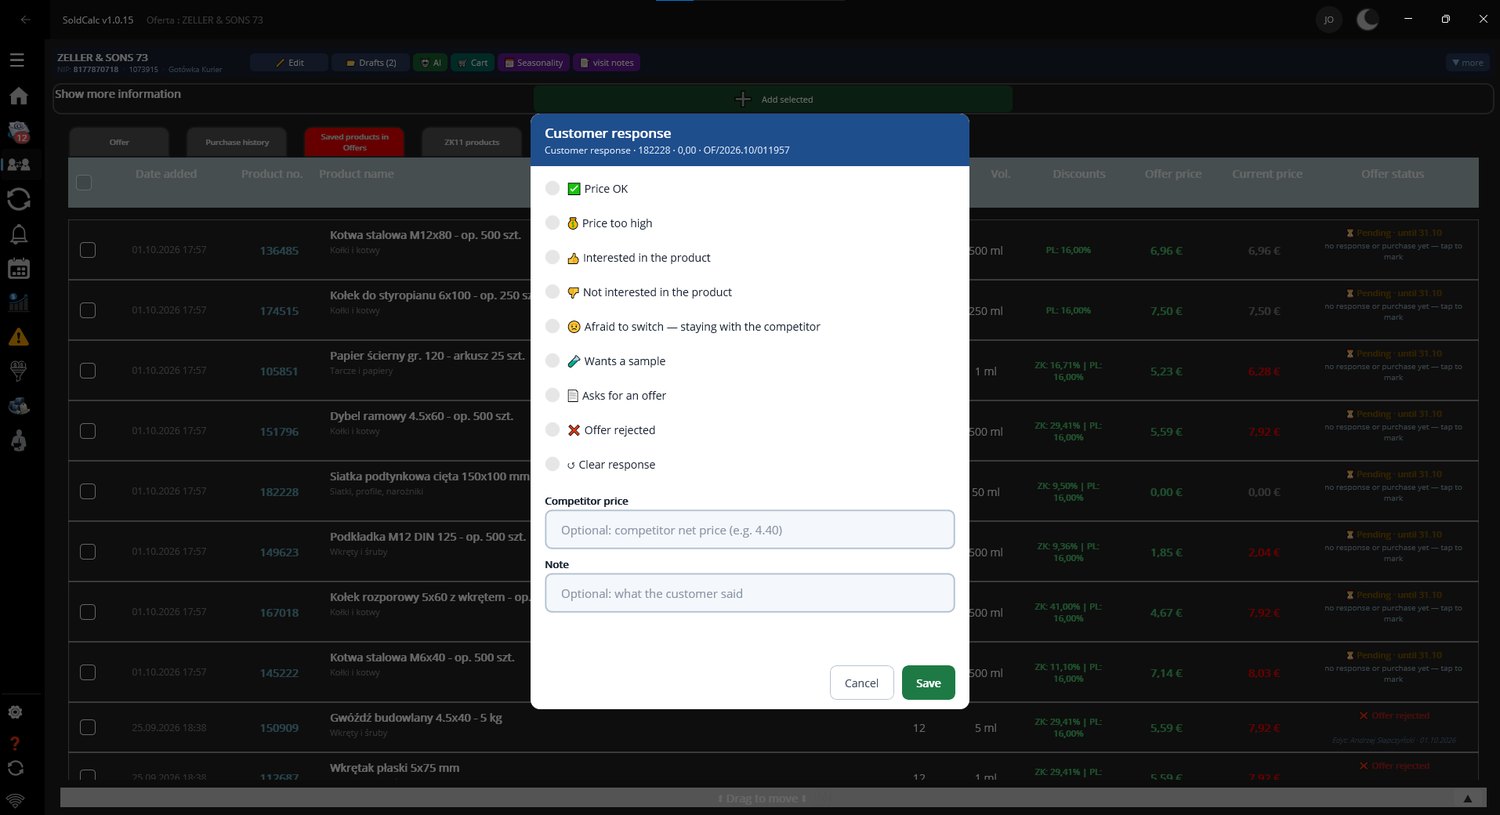
The offer went out. Now what? For every line the rep records the customer response in one click — and that response comes back into the analysis as data, not as someone’s memory of a conversation.
- Ready statuses: price OK, price too high, interested or not interested, wants a sample, asks for an offer, offer rejected
- A separate status for “afraid to switch — staying with the competitor”, because that is a different job from arguing about price
- Add the competitor price and a note to the line: what exactly was said
- The “Offer status” column shows which lines are still waiting for a response
🧮 Basket simulation — see the result before you change the price
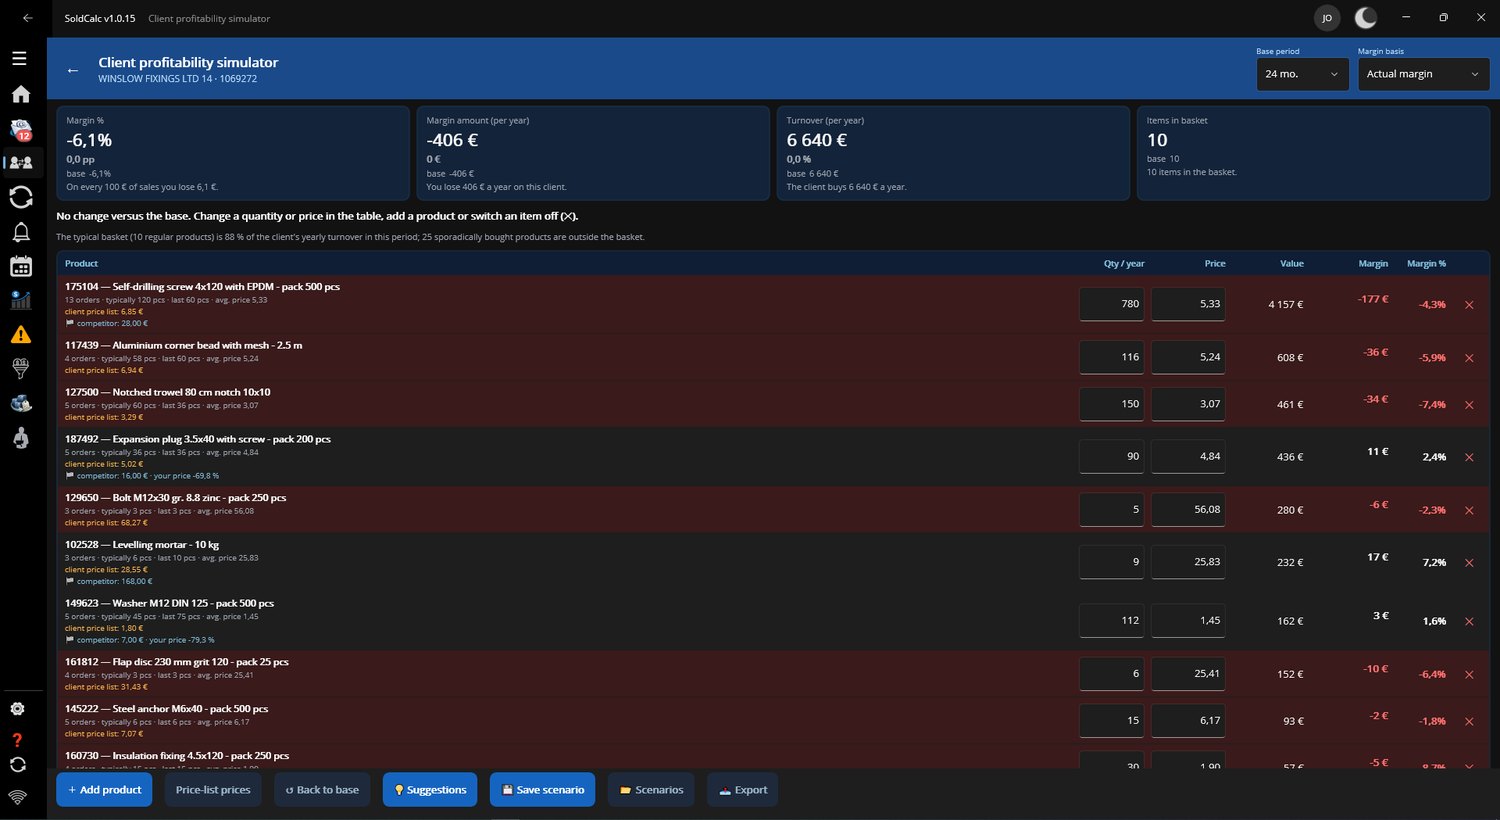
What happens to this customer’s profitability if you raise the price by a few percent, swap one product for another or add a line to the basket? The simulator works on their own purchase history, not on averages.
- A basket built from real orders: quantities, prices, margin in money and in percent — line by line
- Change a quantity or a price in the table and the new annual margin updates at once
- Suggestions from the system: raise the price, swap for an alternative in the same group, add a product that eleven similar customers buy — each with an annual amount
- Free goods and promotions counted as a fixed cost, so the result is not prettier than reality
- Scenarios can be saved, compared and exported
Don’t guess what the customer will do with a price. Work it out before the meeting.
A field visit is not a trip. It is data.
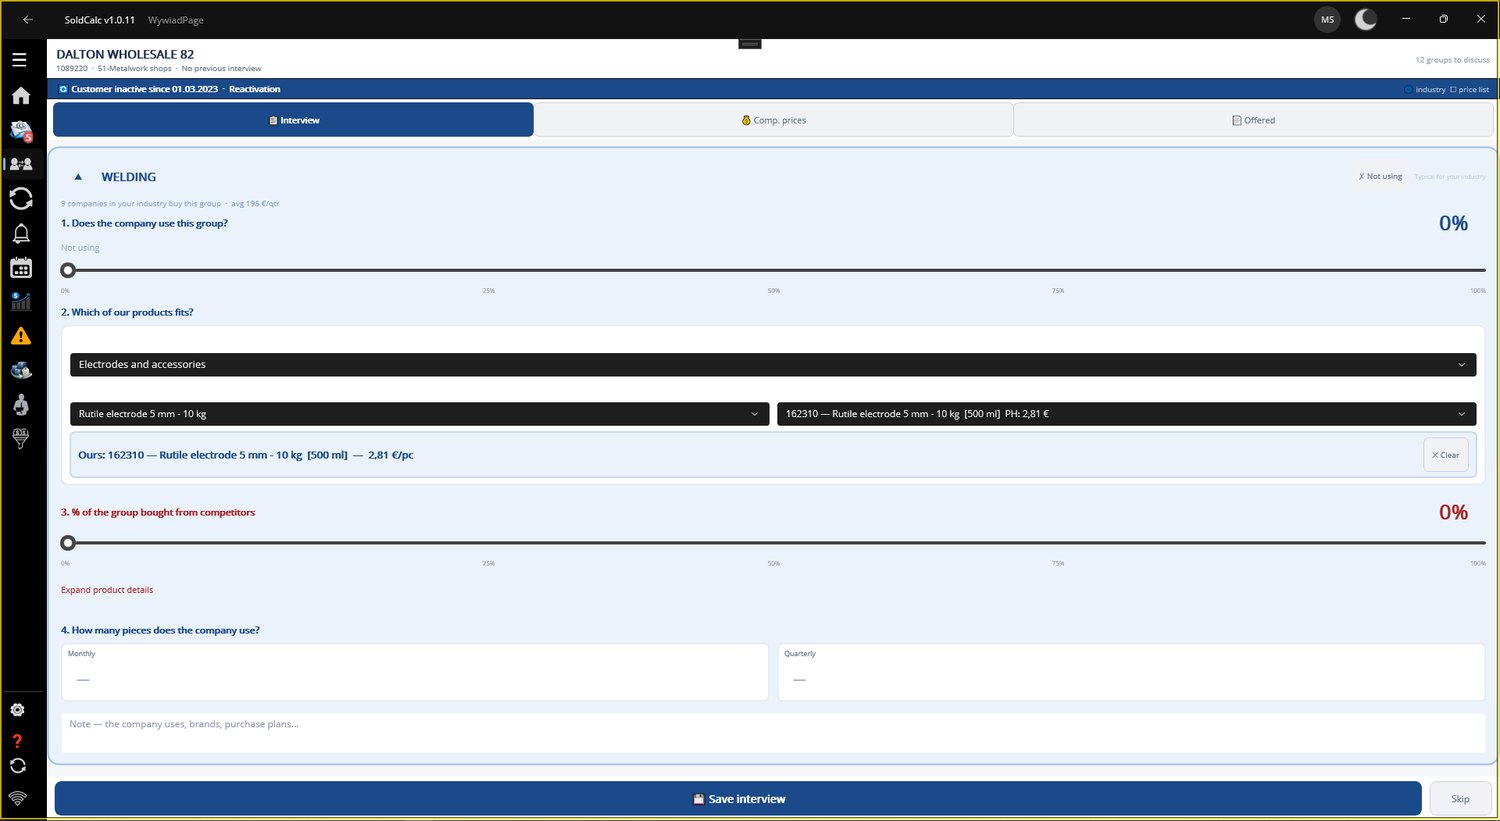
Every conversation at the customer can be turned into comparable data — and every piece of that data changes what the board sees the next morning. This is the part of SoldCalc that turns what your reps already know into a number.
At the customer, in a few clicks
Not a notebook and not a report written on Friday. A short form filled in during or right after the visit.
- which products the customer actually uses, and in what volumes
- whether a competitor is present, and which one
- how much the customer buys elsewhere and at what prices
- how the customer positions us against the alternatives
From answers to a picture of the customer
The database turns single answers into a comparable profile — across customers, industries and regions.
- what they buy from us and in what volumes
- what our real position at this customer is
- where we are stronger and where we are losing
- our share of the customer's total purchases
Position, value, potential
The same field knowledge, aggregated into the three numbers a director can act on.
- customer position and customer value
- share of the customer's purchases
- growth or decline potential — per customer, industry and product
The system knows which of the two is due. The rep does not decide whether this customer needs a full competitive interview or a quick mapping update — SoldCalc checks what is already known about the customer, how old that knowledge is, and opens the right screen the moment the action is started.
How much margin could your company recover?
Four assumptions — yours, not ours. The result is worth exactly as much as they are, but it shows the scale we are talking about.
Of that, 900 000 € is margin that leaks over a year under your assumption.
22 500 € per month — that is 3.0% of your annual margin.
This is not a software purchase. It is an investment in recovering what you are losing anyway — with one difference: nobody sends you an invoice for today's loss.
How we calculate: sales × margin = annual margin → × share of leaking margin = the amount that leaks → × recovery rate = possible recovery. An illustrative calculation, not a promise of results.
SoldCalc works on your company's real data. We don't show slides. We show the result.
In the pilot:
- data import from Excel
- system configuration
- team training
- sales analysis
- margin analysis
- competition analysis
- forecasts
- actions for the sales team
- final report
What does the board get at the end of the Proof of Value?
Don't replace your ERP. Use the data you already have.
We don't ask you to change your whole IT ecosystem. We add a layer that helps turn existing data into decisions and actions.
Your data doesn't have to leave your company.
At a board meeting you don't show 50 screens. You show 5 answers.
Where are we losing money?
Which customers are at risk?
Where is competition taking our sales?
Where can we grow the basket?
How much extra margin can we recover?
From director → manager → rep, everyone sees information appropriate to their role — the same truth, a different level of detail.
How does information from SoldCalc reach the board — and come back to the rep as a concrete action?
The key difference: nobody here has to hunt for the problem or prepare a report. SoldCalc detects the signal in the data itself, weighs its importance and shows the same signal to each role in the right form — to the director as an amount, to the manager as priorities, to the rep as a task.
Sees the scale and the amounts
Profitability, competition and price-impact cockpits: where the company is losing, which regions and topics need attention — without hundreds of tables and charts.
Gets the team's priorities
A list of customers and topics ordered by value: where to intervene, which discounts to approve, which rep to support.
Opens ready-made tasks
"Actions for today": what, at which customer and why — with the opportunity amount. They visit the customer with a concrete topic, not empty-handed.
SoldCalc doesn't wait for someone to find the problem.
The engine analyses sales data, prices, margins, baskets and customer behaviour, then turns the detected signals into concrete actions for the right person.
Plans — from organising the work to recovering money
Pilot (Trial)
30, 60 or 90 days — the full experience, on your own data
- All features of the Max plan
- Data uploaded from Excel
- Configuration and team training
- Final report: what SoldCalc found in your company
- 100% of the fee credited towards implementation
Solo
For a single rep or a very small team
- Customer database and purchase history
- Price list and offers
- Basic analytics (ABC, trends)
- Mail, calendar, map and routes
- Data from CRM and Excel
- "Actions for today" assistant
- Margin Recovery
Standard
For a sales team with a manager
- Everything in Solo
- "Actions for today" assistant
- Cross-sell and basket analysis
- Sales forecasts
- Manager role and pipeline
- Margin Recovery
Max
For companies that watch profit, not just turnover
- Everything in Standard
- Margin Recovery
- Profitability and competition cockpits
- Advanced analytics and forecasts
- Full hierarchy: rep → manager → director
Pricing is always individual — it depends on seats, implementation scope and integrations.
The interface runs in PL · EN · NL and the application handles multiple currencies (PLN, €). Coming up: the Enterprise plan — everything in Max plus AI features.
Let's see what SoldCalc finds in your company.
Share a few basics. We'll come back with a proposal for a 30-minute call and a Proof of Value matched to your company.